Figure 3.
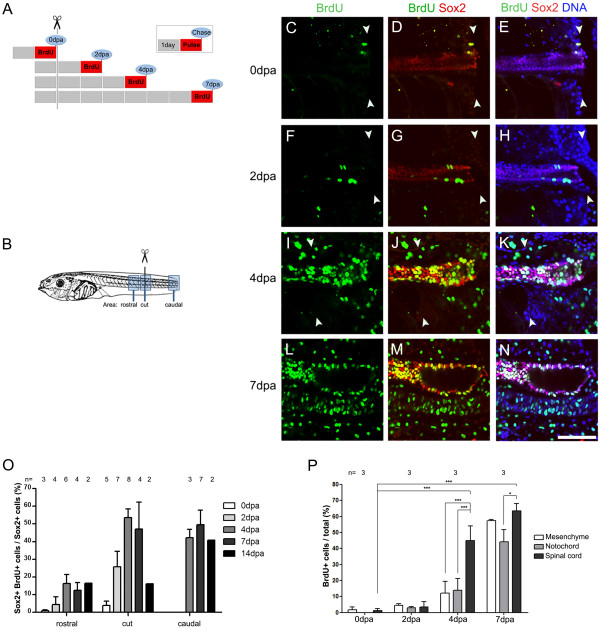
Tail amputation increases proliferation of Sox2+cells. (A) Diagram showing the experimental set up to evaluate incorporation of 5-bromo-2'-deoxyuridine (BrdU) after tail amputation of stage 49 tadpoles. Each box represents 1 day, red boxes indicate BrdU incubation (pulse) and blue circles the day of tail fixation (chase). Tadpoles were incubated in BrdU for 24 h chased at different days post amputation (dpa). Then they were processed for coimmunostaining against Sox2 and BrdU and analyzed as described in (C-P). (B) Diagram of the rostral, cut and caudal regions analyzed in (C-O). (C-N) Sagittal optical section of whole-mount immunofluorescence against BrdU (green) and Sox2 (red) double immunofluorescence from tails labeled as depicted in (A) and fixed at (C-E) 0, (F-H) 2, (I-K) 4 and (L-N) 7 dpa in the cut region (C-K) and caudal region (L-N). DNA is stained in blue. During regeneration, an increase of Sox2+/BrdU+ cells was observed in the spinal cord and (I-N) neural ampulla. Arrowheads indicate the amputation plane. (O) Graph describing the percentage of Sox2+/BrdU+ cells in the overall Sox2+ cells at proximal, cut and caudal regions of spinal cord at different dpa. An increase Sox2+ cell proliferation was observed in all the regions mostly at 4 to 7 dpa. (P) Graph showing the percentage of BrdU+ cells in the spinal cord, notochord and mesenchymal cells at different days post amputation quantified at the cut level. (O,P) The number of tadpoles counted for each point (n) is indicated above the bars. Scale bar: 25 μm.

