Figure 5.
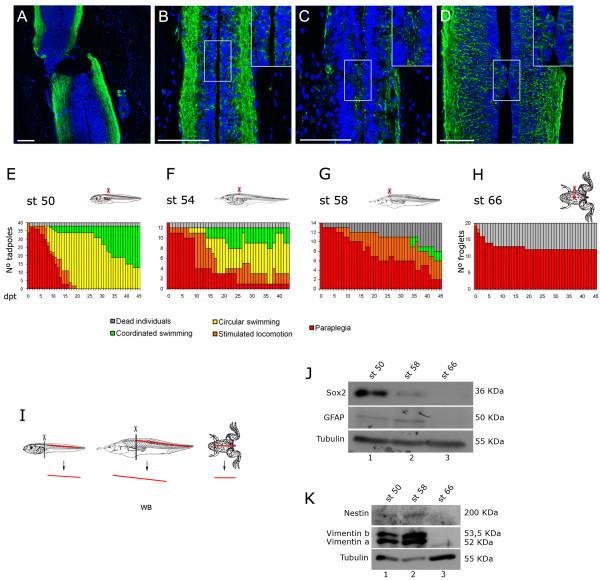
Spinal cord regeneration and Sox2 expression during metamorphosis. (A-D) Immunofluorescences of stage 50 tadpoles against acetylated α-tubulin (green) on horizontal sections from the injured area at (A) 0 days post transection (dpt) with paraplegia phenotype, (B) 0 days post sham operation (dps) that has coordinated swimming, (C) 7 dpt with circular swimming and (D) 28 dpt with coordinated swimming. Insets in (B-D) show 1.5 times magnifications of the areas contained in the frames, which correspond to the transection levels. (E-H) Graphs showing functional recovery of tadpoles transected at different metamorphic stages (st). Functional recovery decreases meanwhile metamorphosis undergoes. (I) Diagram depicting the isolation of spinal cord samples used for J,K. (J,K) Western blot analysis of neural-related markers (J) Sox2, glial fibrillary acidic protein (GFAP), (K) Nestin and Vimentin at different stages of metamorphosis. Scale bars: 50 μm.

