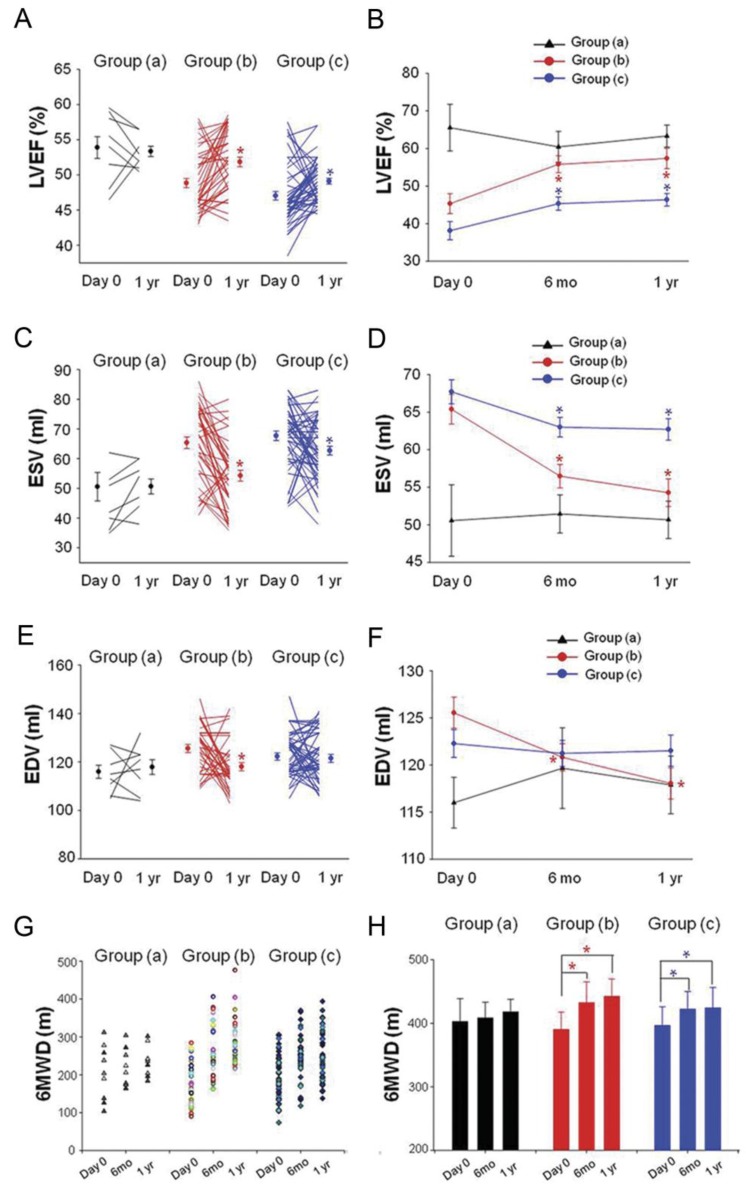
Figure 5.
Changement of LVEF, ESV, EDV and 6MWD. (A, B) LVEF measured at 6 months and 1 year follow up was found to have increased significantly in group (b) and group (c) compared to their baseline respectively (C, D). ESV were decreased significantly in group (b) and group (c) at 6 months and 1 year follow up (E, F). EDV were decreased significantly in group (b) at 6 months and 1 year follow up. LVEF: left ventricular ejection fraction; ESV: end systolic volume, EDV: end diastolic volume. Solid circles represent the mean, T bars the standard error (SE) in A, C, E, T bars the standard deviation (SD) in B, D, F. Quality of life improved as evidenced by 6-min walk distance (6MWD) at 6 months and 1 year follow up in group (b) and group (c) (G, H). *p<0.05 vs baseline.

