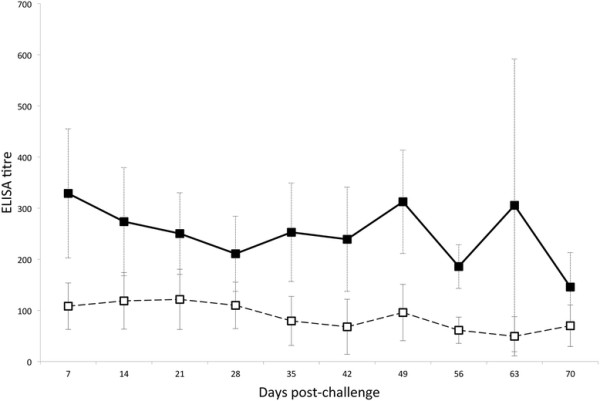
Figure 2.

ELISA analysis of virus-specific antibodies in vaccinated animals from groups 2–4 that were protected from MCF after challenge. Average virus-specific antibody titres in plasma (filled squares, solid line) and in nasal secretions (open squares, broken line) are plotted for all vaccinated and challenged animals that survived to the end of the trial without clinical MCF. Error bars correspond to the standard error of the means.
