
Figure 1.
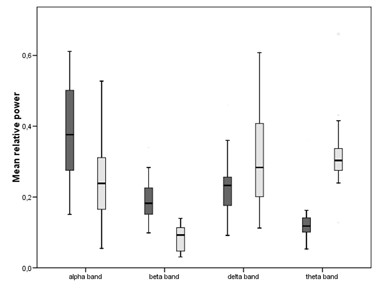
Box plots of mean relative power (SD) for controls and patients in the different frequency bands. Light bars: patients, dark bars: controls.
Official websites use .gov
A
.gov website belongs to an official
government organization in the United States.
Secure .gov websites use HTTPS
A lock (
) or https:// means you've safely
connected to the .gov website. Share sensitive
information only on official, secure websites.
Box plots of mean relative power (SD) for controls and patients in the different frequency bands. Light bars: patients, dark bars: controls.