
Figure 2.
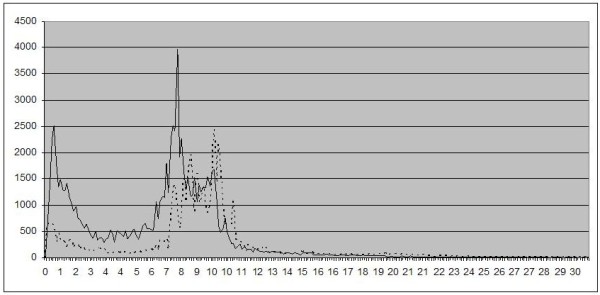
Mean power spectra of EEG activity at the location O2 (right occipital). X-axis: frequency in Hz, Y-axis: absolute power. Solid line: patients, dotted line: controls.
Official websites use .gov
A
.gov website belongs to an official
government organization in the United States.
Secure .gov websites use HTTPS
A lock (
) or https:// means you've safely
connected to the .gov website. Share sensitive
information only on official, secure websites.
Mean power spectra of EEG activity at the location O2 (right occipital). X-axis: frequency in Hz, Y-axis: absolute power. Solid line: patients, dotted line: controls.