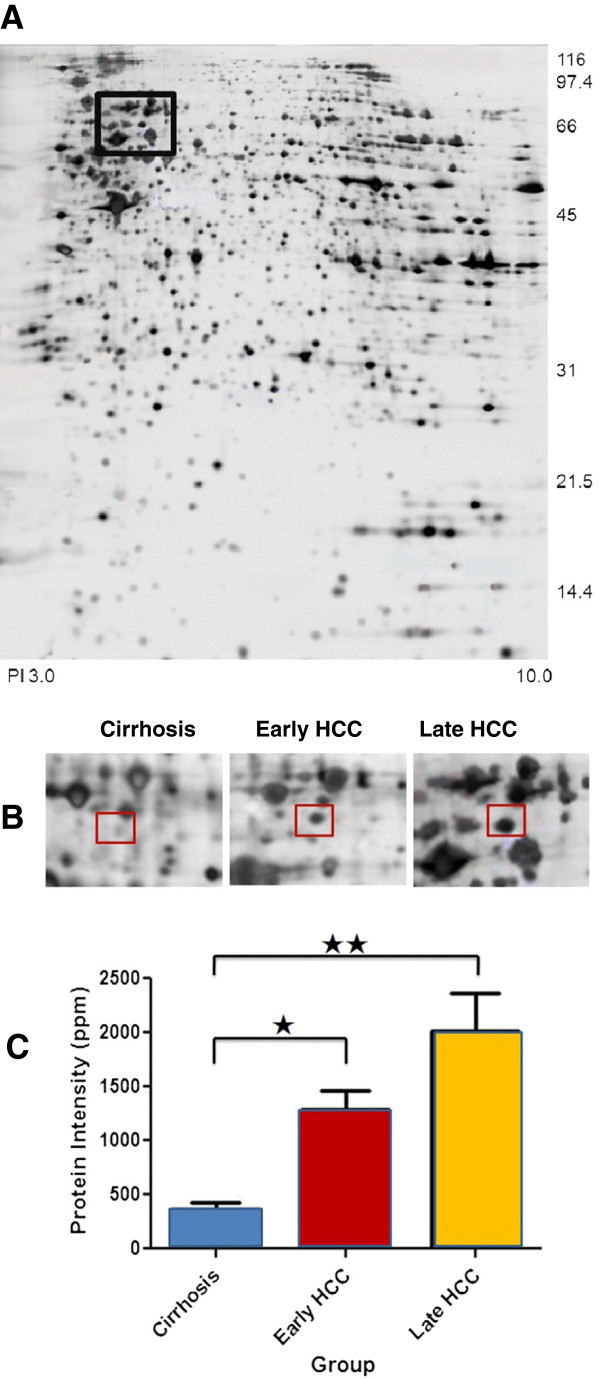
Figure 1.
Overexpression of hnRNP K in HCC tissues. (A) Representative protein profile of tissue sample from a late HCC patient is shown. The black rectangle entails the protein spot SSP2215. (B) Different expression of hnRNP K among cirrhosis(n = 40), early HCC(n = 15), and late HCC(n = 25) tissues in 2-DE gel. The protein spot marked with a square on two-dimensional gel electrophoresis image is protein SSP2215. (C) Histograms with relative protein intensities shows protein spot SSP2215 overexpressed in early and late HCC tissues compared with cirrhosis tissue. ☆, p < 0.01; ☆☆, p < 0.01.

