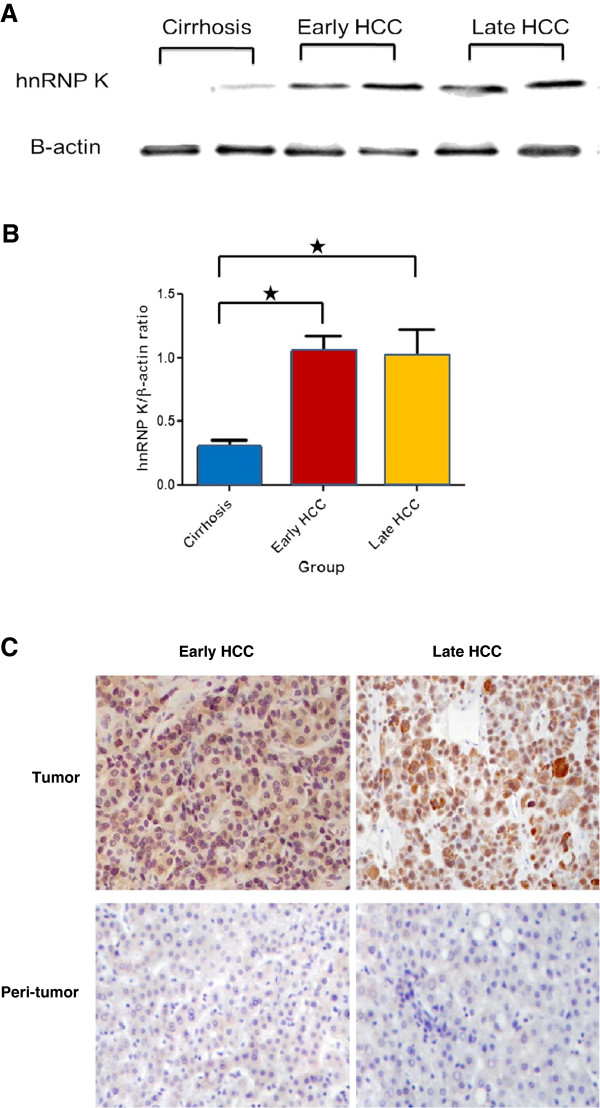
Figure 2.
Validation of hnRNP K overexpressed in HCC of different tumor stages. (A) Representative Western blot analysis demonstrates hnRNP K overexpressed in different stages of HCC tumors compared to cirrhosis samples. β-actin was used as internal loading control. The ratio of hnRNP K/β-actin protein was measured using Scion Image Beta 4.03 software. (B) Histograms showed the average densitometric ratio of hnRNP K to β-actin in early and late HCC tissue compared with cirrhosis control (☆, p < 0.05). (Early HCC/cirrhosis = 3.48; Late HCC/cirrhosis = 3.30). (C) Representative Immunohistochemical staining showed the expression level and cellular localization of hnRNP K in early, late HCC tissues, and peri-tumor cirrhosis tissues. Stronger signal was found at the nucleus than that in cytoplasma in tumor cells, but limited nucleus staining in cirrhotic tissues (Original magnification × 400).

