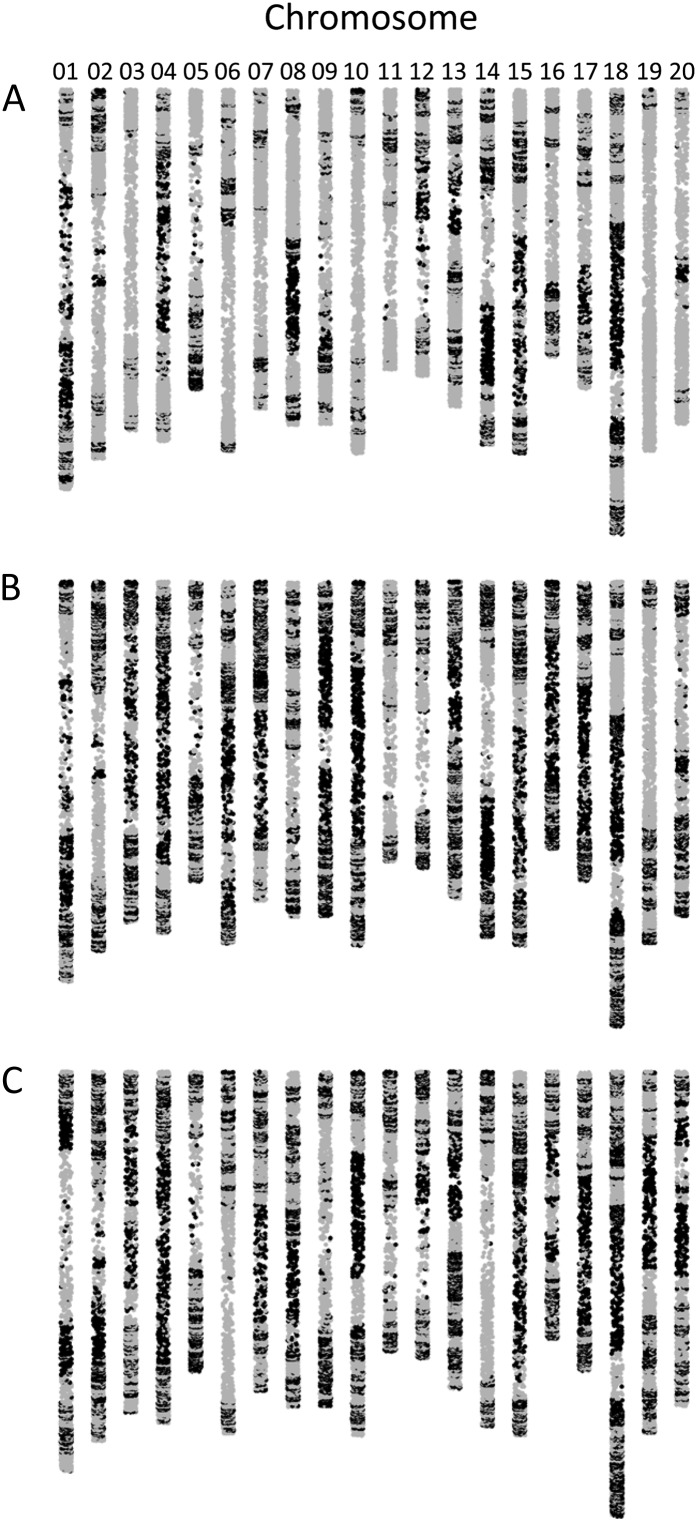
Figure 1.
SNP genotyping reveals regions of conservation and divergence between Wm82 and Archer (A), Wm82 and Minsoy (B), and Wm82 and Noir 1 (C). Gray spots indicate matching SNPs, and black spots indicate polymorphic SNPs between genotypes. The spots are jittered along the x axis to enhance the resolution of the data points.

