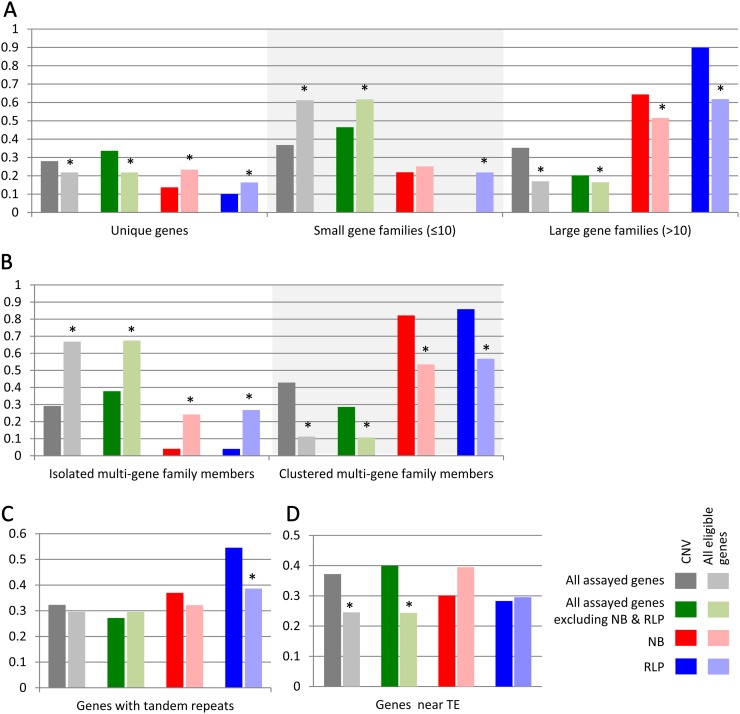
Figure 5.
Enrichment or depletion of CNV in comparison with expectation (all eligible genes) for each gene class. Genes were divided by gene class (e.g. all genes, NB or RLP) as well as groups based on structural characteristics (e.g. size of the gene family). The proportion of genes with a particular structural feature within each gene class is presented. This proportion is presented for genes located within CNV as well as for all genes assayed for CGH comparisons. Significant differences (Fisher’s exact test; P < 0.05) between the proportion of genes within CNV regions and within all eligible genes for each category are indicated by asterisks. A, Proportion of genes that are unique or in small or large gene families. B, Proportion of genes that are clustered or isolated members of multigene families. C, Proportion of genes that contain tandem repeats. D, Proportion of genes within 5 kb of a TE.

