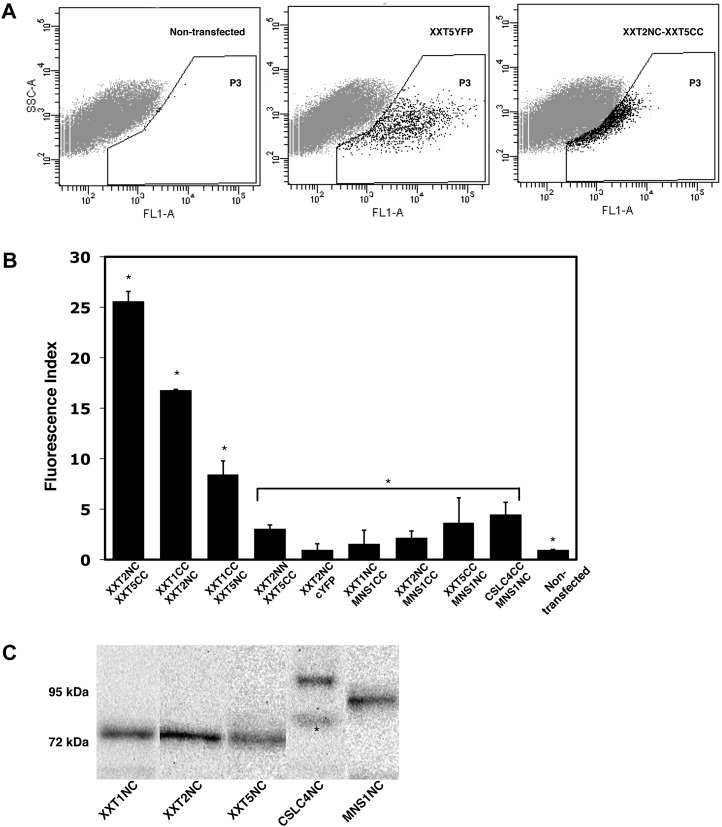
Figure 3.
Heterodimerization of XXTs. A, Flow cytometry quantification of BiFC signal. The plots show the results obtained after protoplasts were analyzed by flow cytometry. A Negative control (nontransfected protoplasts) and a positive control (XXT5YFP) were used to determine the gated area (P3) by the brightness of each protoplast (FL1-A). Each protoplast (a dot) localized in the P3 area represents a fluorescent event (an example is shown for XXT2NC and XXT5CC coexpression). B, BiFC signal intensities determined by flow cytometry for different XXT pairs and all negative controls. The calculation of fluorescence index is described in “Materials and Methods.” Values shown are means ± se. Asterisks indicate significant differences (t test, P < 0.05; n = 5) among experiments, negative controls, and nontransfected protoplasts. C, Estimation of protein expression in Arabidopsis protoplasts. The protein expression of GTNC constructs (all three XXTNCs, approximately 75 kD; CSLC4NC, approximately 99 kD; MNS1NC, approximately 80 kD) was detected using monoclonal GFP antibody. Asterisks indicate nonspecific binding.

