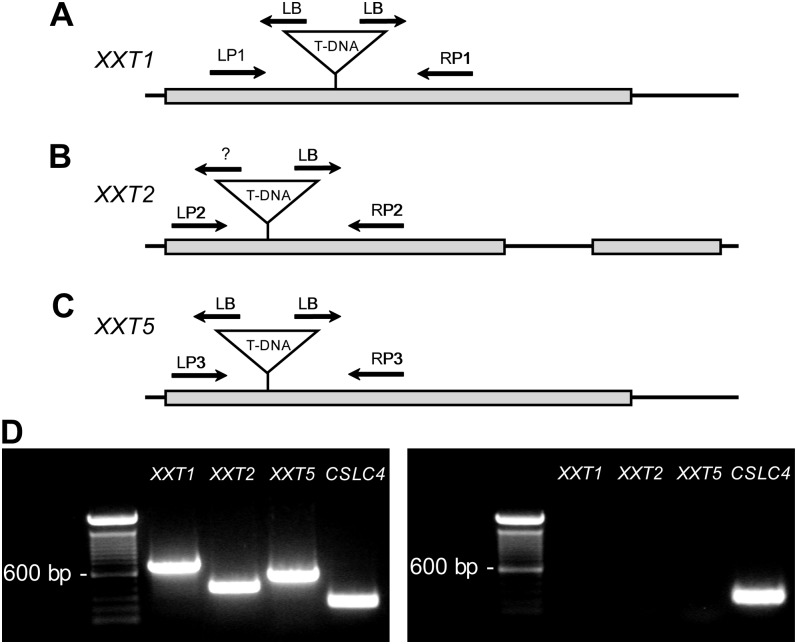
Figure 1.
Analysis of the xxt1 xxt2 xxt5 T-DNA insertion mutant. A to C, Gene models of XXT1, XXT2, and XXT5, respectively. Noncoding regions and introns are represented by black lines; coding regions are represented by gray boxes. The T-DNA insertion site for each gene is indicated along with the T-DNA border. LB, Left border; LP, left primer; RP, right primer; ?, unknown border. D, RT-PCR analysis of the wild type (Col-0; left panel) and the xxt1 xxt2 xxt5 T-DNA insertion mutant (right panel) using the gene-specific primers denoted in A to C that flank the T-DNA inserts. Further details can be found in Supplemental Data S1.

