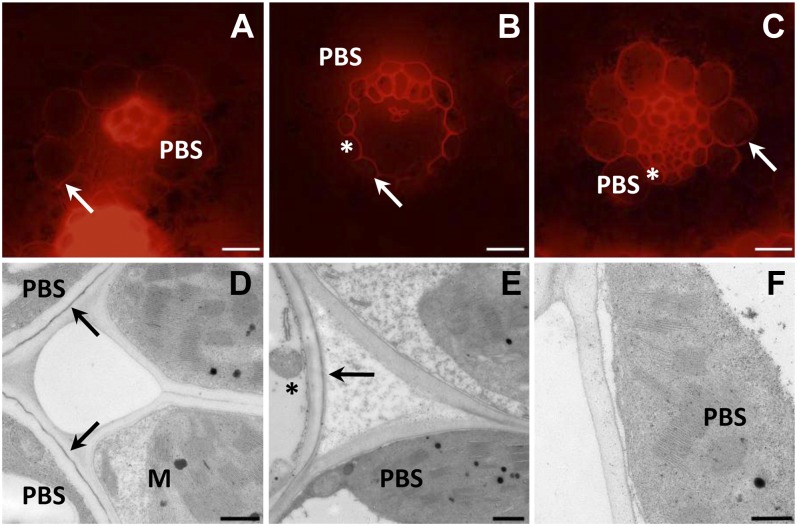
Figure 2.
Maize chromosome 3 causes lipid deposition in oat PBS cell walls. Fluorescence (A–C) and TEM (D–F) images of transverse sections of maize (A and D), oat (sun II; B and E), and OMA 3.01 (C and F) leaves are shown. Lipid detection was carried out by staining sections with Nile red (A–C). Suberin detection was by TEM (D–F). Asterisks indicate MS. In TEM images, arrows indicate suberin layers. Bars = 20 μm (A–C) and 500 nm (D–F).

