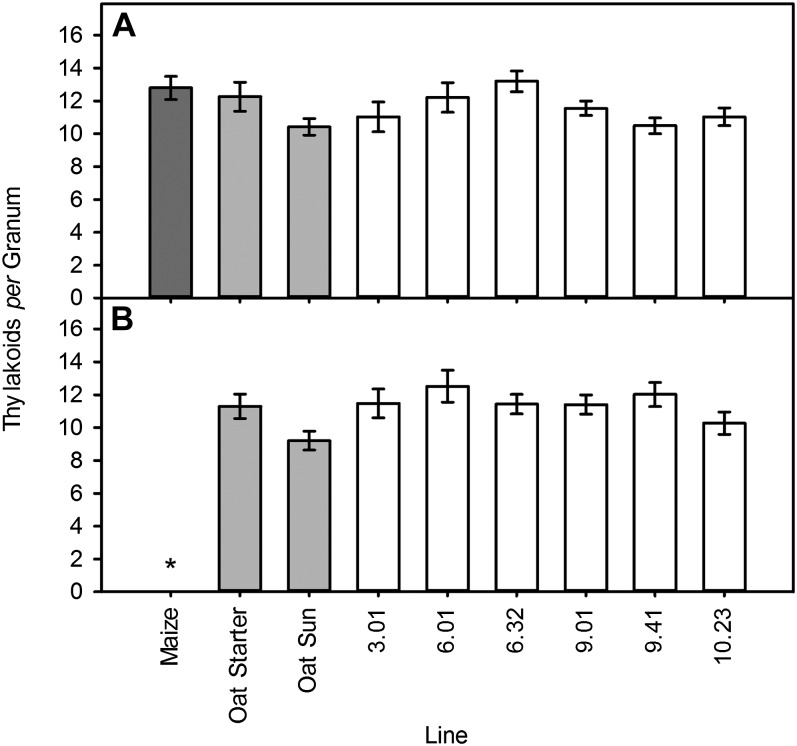
Figure 6.
Thylakoid stacking in grana of oat PBS cells is unchanged by maize chromosomal introduction. Numbers of thylakoid stacks per granum in M (A) and bundle sheath chloroplasts (B) in maize, oat, and OMA leaves are shown. Results are expressed as means ± se of three biological replicates with a minimum of 10 measurements per leaf. Starred results are statistically significant relative to oat controls (P < 0.01).

