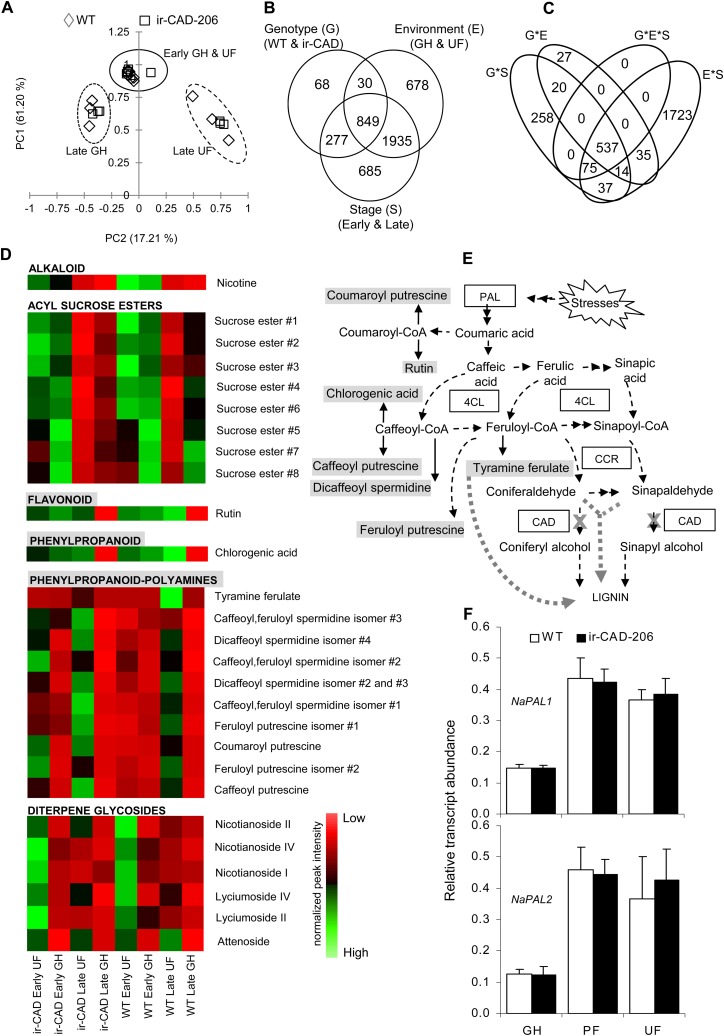
Figure 7.
Levels of PAL transcripts and associated metabolites increase in UF-grown plants during later growth stages. A, Principal component analysis score plot of 6,320 metabolite ions obtained after processing of the raw LC-ESI-TOF MS data set from stems of early- and late-stage wild-type (WT)/ir-CAD plants grown in different environments. The metabolite profiles of both genotypes were similar at the early stage of plant development irrespective of growth environment but differed when the plants started to lignify (n = 3). B and C, Venn diagrams summarize the influence of three components, genotype (G), environment (E), and growth stage (S; B), and their interaction (C) on soluble secondary metabolite ion accumulation in 10-cm-long basal segments of nonlignified (early stage of development; i.e. before the onset of red color in ir-CAD stems) and late-stage lignified stems of ir-CAD-206 and wild-type plants grown in UF and GH growth conditions and analyzed by LC-ESI-TOF MS (three-way ANOVA: P < 0.001). D, Heat map showing the changes in metabolite accumulation in stems occurring across wild-type/ir-CAD plants grown in different environments. Each square represents the average value of normalized peak intensities obtained from three biological replicates ranging from high (green) to average (black) to low (red) levels. E, Biosynthetic associations among measured soluble metabolites and lignin biosynthesis (represented by dashed black arrows). The thick gray dotted arrow depicts metabolite flux into lignin when the CAD gene is silenced (denoted by a cross). F, Mean ± se NaPAL1 (top panel) and NaPAL2 (bottom panel) transcript levels measured by qRT-PCR in wild-type and ir-CAD upper stem parts (50–60 cm from the ground level) harvested from flowering plants grown in GH, PF, and UF growth conditions (n = 6). Elongation factor, an unregulated housekeeping gene, was used to normalize all qRT-PCR assays.

