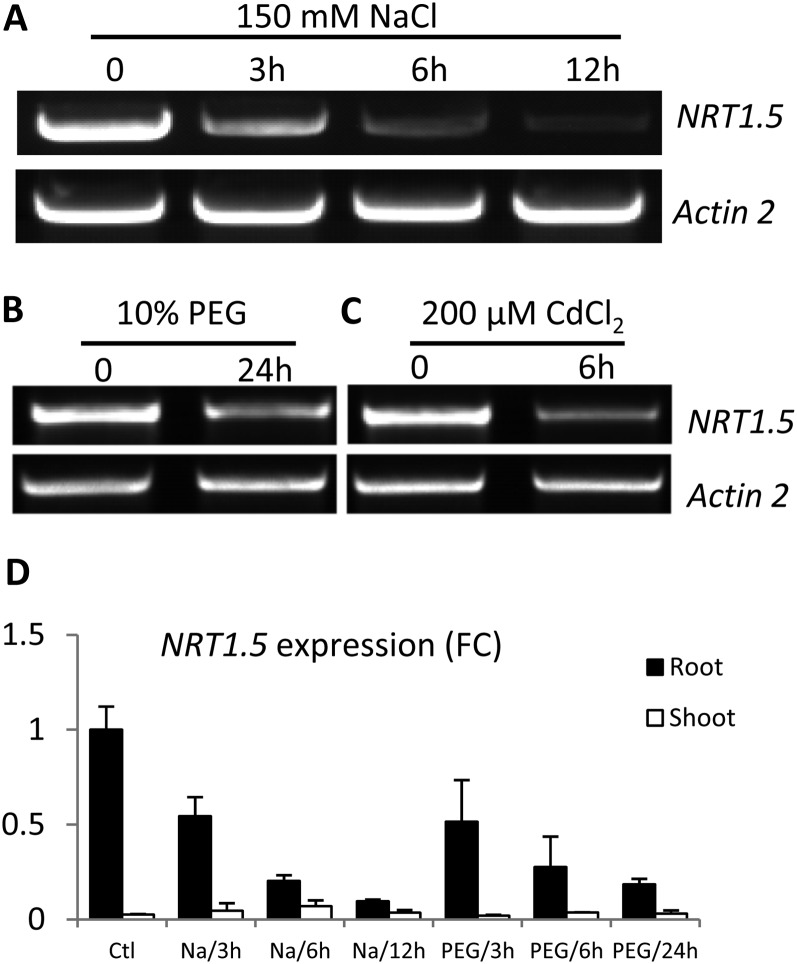
Figure 1.
A to C, Down-regulation of NRT1.5 by various stresses. Plants were grown hydroponically for 4 weeks and then exposed to 150 mm NaCl (A), 10% PEG (B), or 200 μm CdCl2 (C) treatment for the indicated times. NRT1.5 mRNA levels in roots were determined by RT-PCR. D, Quantitative RT-PCR determination of NRT1.5 expression in both shoots and roots exposed to 200 mm NaCl or 10% PEG for the indicated times. The y axis shows fold change (FC) compared with the control (Ctl). Values are means ± sd (n = 3). Actin2 was used as a loading control.

