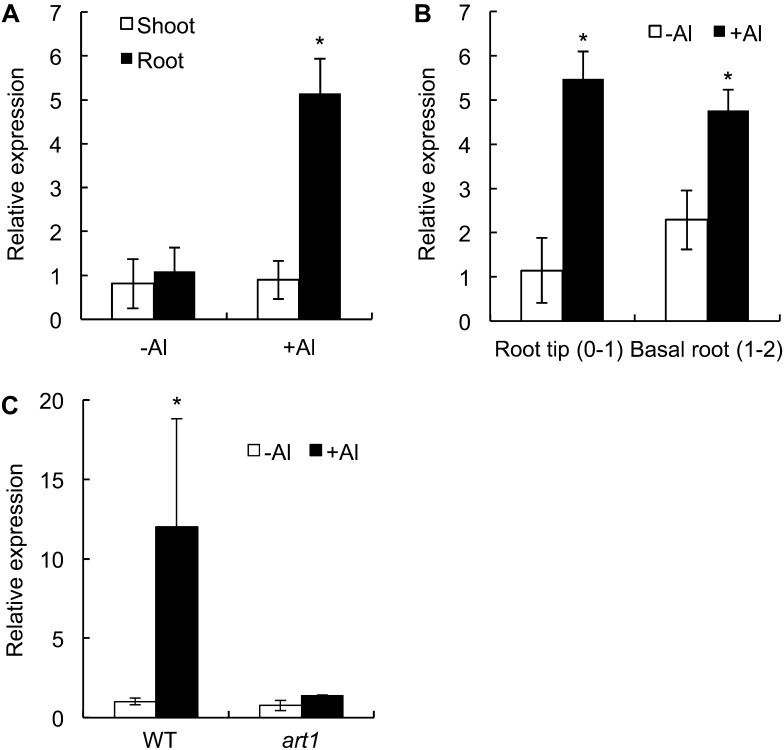
Figure 1.
Expression pattern of OsMGT1 in rice. A, Expression of OsMGT1 in the roots and shoots. Rice seedlings were exposed to a solution containing 50 μm Al at pH 4.5 for 6 h and the roots and shoots were sampled for analysis. B, Root spatial expression. After exposing to 50 μm AlCl3 for 6 h, root segments (0–1 cm and 1–2 cm) were excised with a razor. C, Expression of OsMGT1 in the art1 mutant. Both wild-type (WT) rice and the art1 mutant were exposed to 20 μm AlCl3 for 4 h. The expression level was determined by real-time RT-PCR. Histone H3 was used as an internal standard. Expression level relative to WT root (−Al) in A, C, and to root tip (−Al) in B is shown. Data are means of three biological replicates. The asterisk shows a significant difference (P < 0.05 by Tukey’s test).

