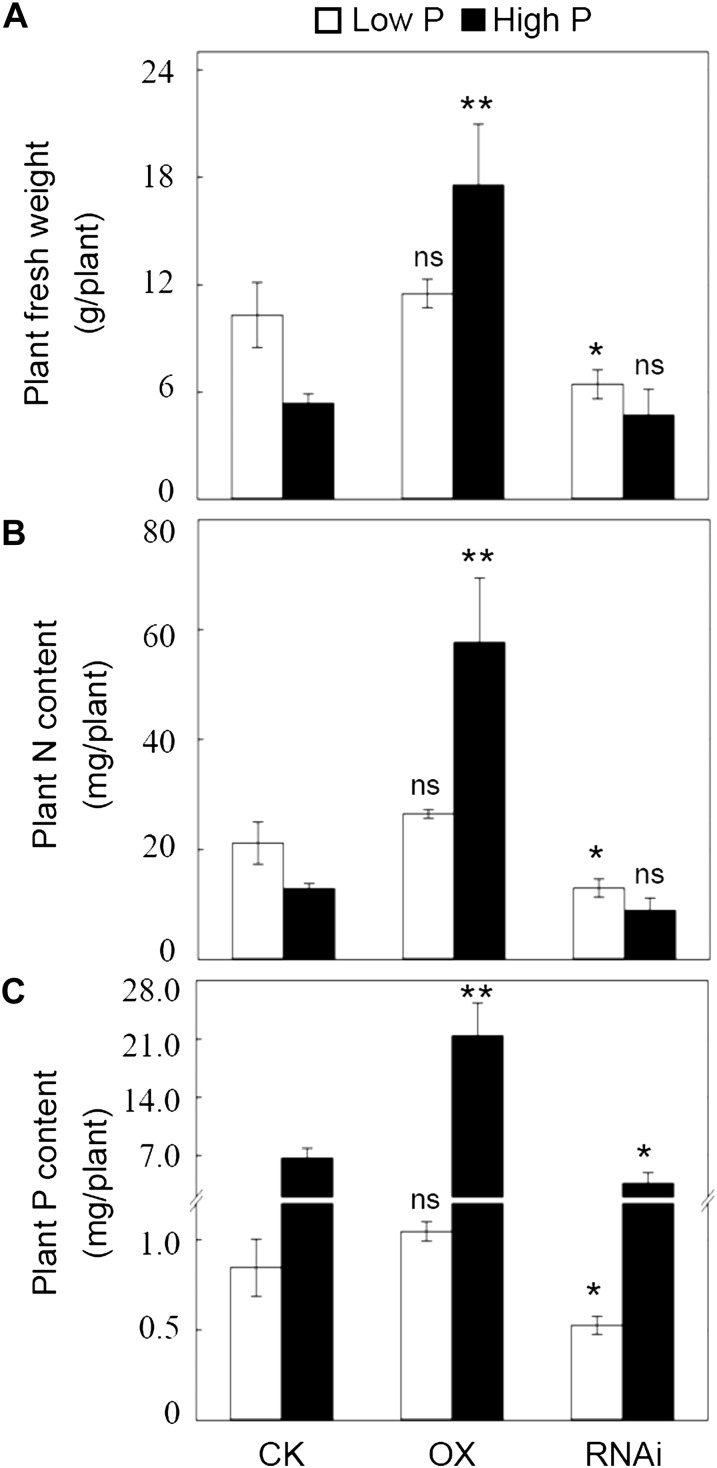
Figure 5.
Effects of OX and RNAi lines of GmPT5 on soybean growth and N and P contents. A, Plant fresh weight. B, Plant N content. C, Plant P content. Soybean transgenic plants inoculated with rhizobia were grown in the low-N nutrient solution with low P (5 μm P) and high P (250 μm P) for 50 d. CK, Soybean transgenic plants carrying empty vector. There were four biological replicates for each treatment, and bars show means ± se. Asterisks indicate significant differences of the same trait between OX or RNAi and CK at the same P level in t tests: * P < 0.05, ** 0.001 < P < 0.01; ns, not significant at 0.05.

