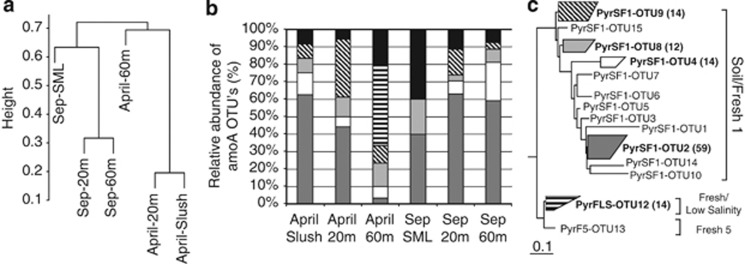
Figure 6.
Different analyses carried out with sequence data from the six amoA clone libraries of Lake Redon in April and September as in Figure 4. (a) Hierarchical clustering analysis. (b) AOA community structurere presented by relative abundances of the five most represented OTUs (i.e., OTUs 2, 4, 8, 9 and 12, see labels and number of sequences within each group in panel c) whereas the remaining OTUs are condensed (black bars). (c) Collapsed maximum likelihood tree inferred by RaxML and based on 579 nucleotides positions. See more details in Supplementary Figure. S1. Scale bar, 10% estimated divergence.

