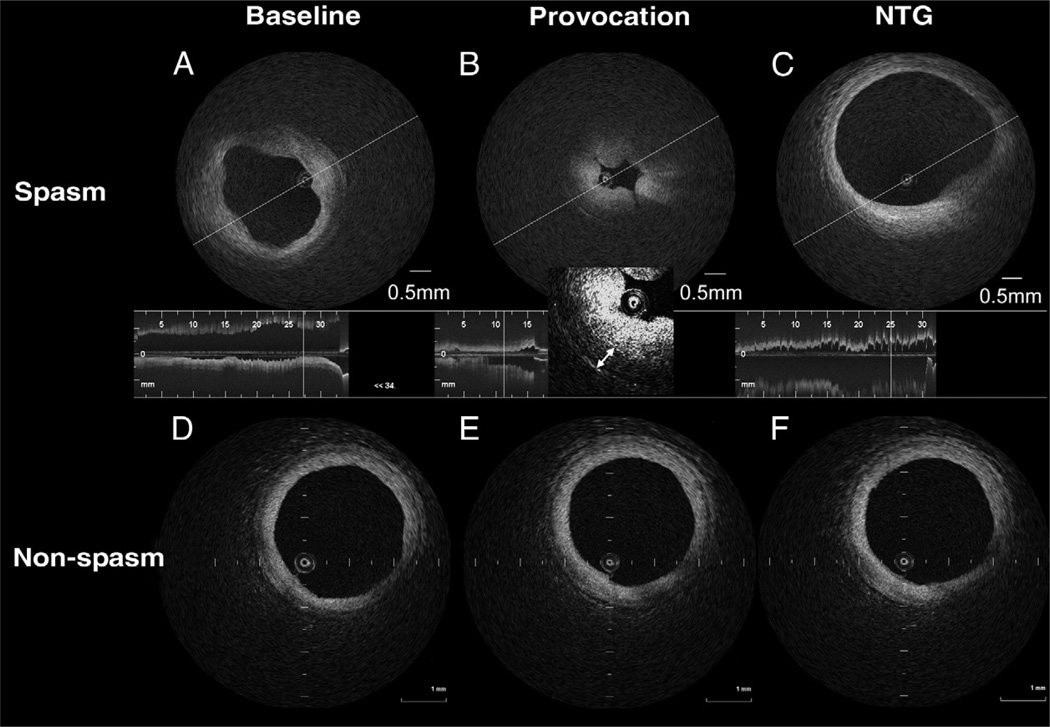
Figure 2. Representative OCT Images of a Spasm Lesion and a nonspasm Lesion.
Representative optical coherence tomography (OCT) images of a spasm lesion (A, B, C) and a nonspasm lesion (D, E, F). (A) The OCT showed intimal bumps that deformed the lumen. A thickened medial layer can be seen. (B) Medial thickness increases, causing luminal narrowing with intimal gathering. Medial thickness is 0.38 mm (double-headed arrow). (C) Both intimal bumps and gathering have disappeared. (D, E, F) No obvious morphological change can be seen in the nonspasm lesion throughout the provocation test. NTG = nitroglycerine.

