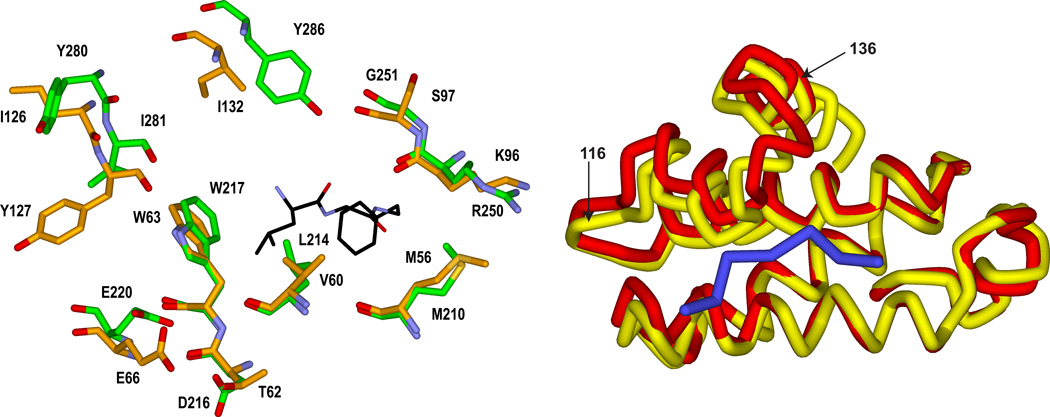
Figure 1.
Left Panel. Overlay of crystal structures of cyclin D1 (orange carbon atoms; 2W96) and cyclin A2 (1OKV) illustrating similarities and differences of CBM contacting residues. The Leu and Phe residues of the CBM interacting with the primary hydrophobic pocket are shown. E220 and D216 comprise the acidic region and the secondary hydrophobic pocket is to the left of W217. Right Panel. Ribbon representation of the overlay highlighting the differences in the cyclin box helices. Cyclin D1 is shown in yellow and the CGI peptide in blue. . The region displaying the largest structural differences after superimposing the backbone atoms is labeled (residues 116–136 of cyclin D1).

