Figure 3.
Crosstalk with synaptically-induced plasticity
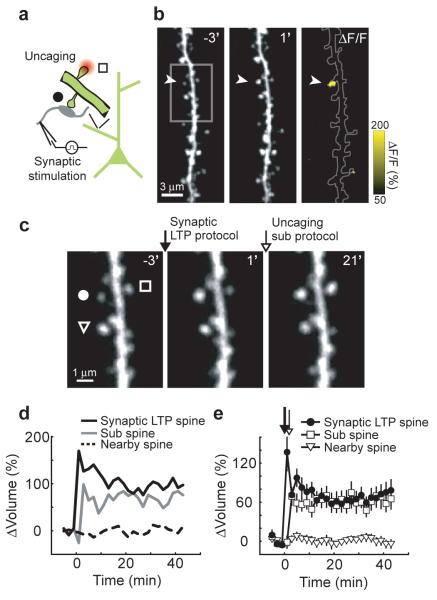
(a) Schematic of the experiment.
(b) Images before (−3′) and after (1′) the synaptic LTP protocol (applied at time = 0; 120 stimuli, 2 Hz in low extracellular Mg2+). The arrowhead marks an enlarged spine (synaptic LTP spine). A ratio image (ΔF/F) comparing fluorescence intensity before (−3′) and after (1′) the synaptic LTP protocol is shown.
(c) High zoom images before (−3′) stimulation, after (1′) the synaptic LTP protocol (applied at time = 0), and after (21′) the subthreshold protocol (applied at time = 2 minutes). A circle, square, and triangle mark the synaptic LTP spine, the sub spine, and a nearby spine, respectively.
(d) Changes in spine volume for the example shown in (b-c).
(e) Time-course of the change in spine volume for synaptic LTP spines (n = 11), sub spines (n = 11), and nearby spines (n = 34), mean ± sem.

