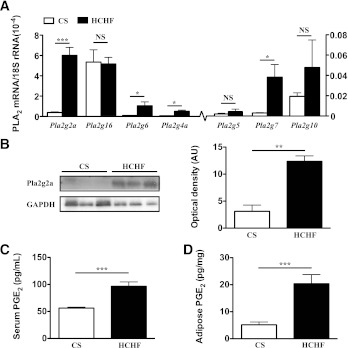
FIG. 1.
RT-PCR gene expression of different PLA2 enzymes and protein expression of pla2g2a in rat adipose tissue. A: Quantitative comparison of mRNA expression level of PLA2 enzymes in adipose tissue from rats fed CS vs. HCHF diets for 16 weeks. Values of PLA2 mRNA levels were normalized relative to the housekeeping gene 18S rRNA. B: Immunoblot of pla2g2a protein levels in adipose tissue with glyceraldehyde-3-phosphate dehydrogenase (GAPDH) used as a loading control. Each lane represents adipose tissue homogenate from a single rat. Optical density of protein bands was determined using ImageJ software. Serum (C) and adipose (D) homogenate concentrations of PGE2 from CS vs. HCHF fed rats. Error bars represent means ± SEM (n = 3–5 animals). *P < 0.05, **P < 0.01, ***P < 0.001.

