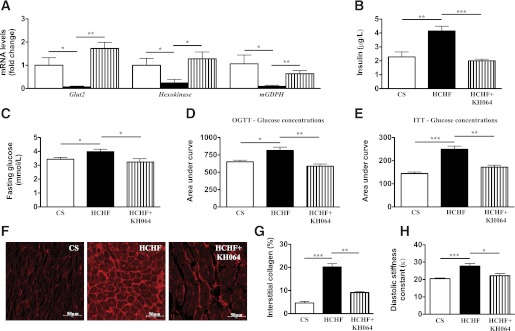
FIG. 6.
In vivo and ex vivo responses to KH064 (5 mg/kg/day p.o. for weeks 8–16) of the regulation of metabolic and cardiovascular parameters that were elevated in rats fed HCHF vs. CS diets for 16 weeks. A: RT-PCR analysis of glucose metabolism genes in rat pancreas of different groups. B: Plasma concentrations of insulin in rats of different groups (n = 5). C: Fasting blood glucose concentrations in rats of different groups (n = 6 for all groups). D: Oral glucose tolerance tests (OGTT) in rats of different groups (n = 6 for all groups). E: Insulin tolerance test (ITT) in rats of different groups (n = 6 for all groups). F: Representative images (original magnification ×40) of interstitial collagen deposition in the left ventricle. G: Quantitative measurement of the area of collagen deposition in the interstitial region of the left ventricle (n = 4 for all groups). H: Diastolic stiffness constant of rats in different groups. Error bars represent mean ± SEM (n = 3–5 animals). *P < 0.05, **P < 0.01, ***P < 0.001. (A high-quality color representation of this figure is available in the online issue.)

