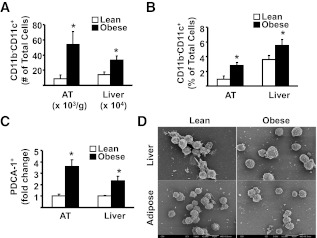
FIG. 4.
The influence of obesity on CD11b−CD11c+ DCs and pDC (CD11b−CD11c+B220+) in AT and liver. For A and B, mononuclear cells from liver and SVC from AT were isolated from lean and obese mice, stained for appropriate markers, and analyzed by flow cytometry (see also Fig. 3G and H, gate 5, which represents CD11b−CD11c+ cells). A: Number of CD11b−CD11c+ DC in AT and liver. B: Proportion of CD11b−CD11c+ DC among SVC in AT and mononuclear cells in liver. There were a minimum number of 6 animals per group. Results are presented as means ± SE. Significant differences are indicated (*P < 0.05). Results are presented as means ± SE. C: Isolated cells from AT and liver were first separated into PDCA-1+ (plasmacytoid DC antigen-1, ∼65% of PDCA-purified cells were CD11c+, CD11b−, B220+) and PDCA-1− fractions using immunomagnetic beads, labeled for specific markers, and analyzed by flow cytometry. For each individual experiment, immune cells from 2 lean animals (pooled) and 1 obese animal were used. The fold increase of PDCA-1+ cells that were also CD11b−CD11c+B220+ (pDC) in AT and liver of obese vs. lean mice is shown. Results are presented as means ± SD; n = 3 separate experiments (6 lean and 3 obese animals). Significant differences are indicated (*P < 0.05). D: Cell suspensions isolated from liver and AT were separated into PDCA+ and CD11c+PDCA-1− fractions using immunomagnetic beads and PDCA+ cells prepared for SEM. SEM was performed separately on cells from three individual obese mice (n = 3), and cells from 6 lean mice were pooled in groups of 2 (n = 3). PDCA-1+ cells appear as a relatively homogeneous population, with round surface and short dendrites—the morphology typical of freshly isolated pDC.

