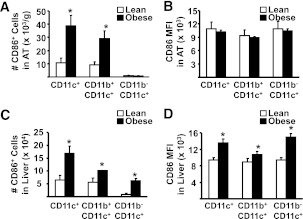
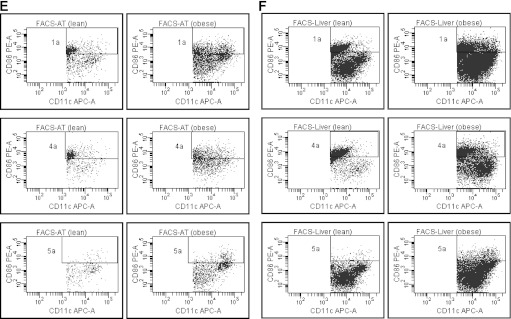
FIG. 6.
The influence of obesity on maturation of DC in AT and liver. Isolated mononuclear cells from liver and SVC from AT were stained for markers to define subsets of CD11c+ as well as CD86+ cells and analyzed by flow cytometry (n = minimum of 6 animals per group). Results are presented as means ± SE, and significant differences are indicated (*P < 0.05). A: Number of CD11c+CD86+ cells isolated from AT. B: MFI for CD86 on CD11c+CD86+ cells from AT. C: Number of CD11c+CD86+ cells isolated from liver. D: MFI for CD86 on liver CD11c+CD86+ cells. E: Representative flow cytometry plots of CD86+ cells in AT, corresponding to A and B. Gate 1a represents CD11c+CD86+ cells; gate 4a represents CD11b+CD11c+CD86+ cells; and gate 5a represents CD11b−CD11c+CD86+ cells. F: Representative flow cytometry plots of CD86+ cells in liver, corresponding to C and D. Gate 1a represents CD11c+CD86+ cells; gate 4a represents CD11b+CD11c+CD86+ cells; and gate 5a represents CD11b−CD11c+CD86+ cells. FACS, fluorescence-activated cell sorter; APC, allophycocyanin.


