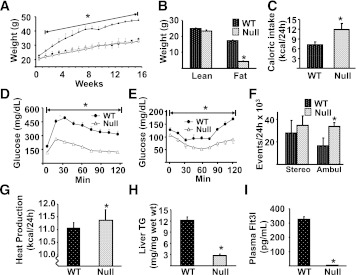
FIG. 8.
The effects of DC deletion on DIO. A: 7-week-old wild-type (WT) and Flt3l−/− (Null) mice were exposed to either the SCD (○, WT; □, Null) or HFD (●, WT; ■, Null) for 16 weeks and their weight recorded weekly. B–I: WT and Null mice were maintained on the HFD. A minimum of 6 animals per group were analyzed, and data are presented as means ± SE. Significant differences are indicated (*Compared with WT mice on the HFD, P < 0.05). B: Body composition of WT and Null mice was assessed using a Lunar PIXImus densitometer (Lunar, Madison, WI) during the last week of feeding, as described previously (20). C: Caloric intake was assessed for individually caged mice. D: The GTT was performed after 13 weeks of dietary exposure (●, WT mice; △, Null mice). E: The insulin tolerance test was performed 1 week after GTT. Animals were injected IP with 0.75 units/kg of Humulin R (Lilly, Indianapolis, IN) and glucose measured in tail vein blood samples. F: Stereotypical (stereo) and ambulatory (ambul) activity was measured over 24 h by infrared beam interruption (Opto-Varimex mini; Columbus Instruments, Columbus, OH). G: Metabolic rate was analyzed in WT and Null animals during the first week of diet, i.e., before weight gain for 24 h at 23°C by indirect calorimetry using CLAMS (Columbus Instruments). Data were analyzed by repeated-measures ANOVA, followed by Tukey’s post hoc test using the SPSS program. H: Triglyceride (TG) content of the liver. I: Plasma Flt3 ligand level was measured using the Mouse Flt3 Ligand ELISA kit (R&D Systems), as per the manufacturer’s instructions.

