Figure 3.
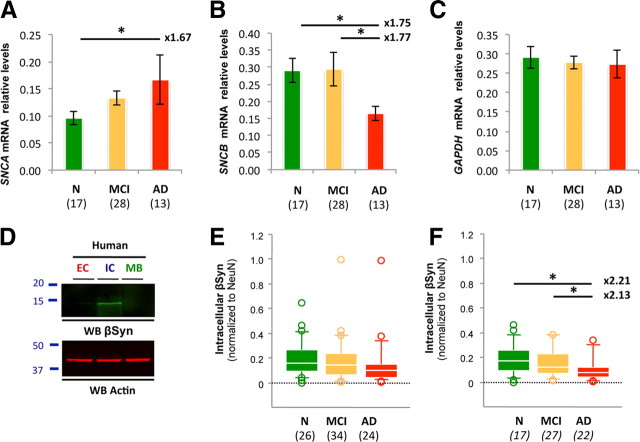
SNCA and SNCB gene expression in the ROS cohort. A–C, SNCA (A), SNCB (B), and GAPDH (C) mRNA levels were measured by rt-qPCR and normalized to the housekeeping gene β-actin. GAPDH was used as the internal control. Quantification revealed an ∼1.7-fold increase in SNCA gene expression in AD compared with age-matched controls, consistent with the approximate twofold elevation of soluble αSyn observed at the protein level. SNCB mRNA levels were lowered by ∼1.8-fold. D, Western blot (WB) analyses illustrating the biochemical segregation of soluble βSyn in EC-, IC-, or MB-enriched fractions. E, Quantification of βSyn in the inferior temporal cortex of subjects with NCI, MCI, or AD. No statistical changes were observed. F, In the absence of LB pathology, βSyn levels were reduced by approximately twofold in AD compared with controls. Values represent mean ± SD (ANOVA followed by Fisher's PLSD test, *p < 0.05). Italicized numbers in parentheses indicate group sizes. NCI is shown in green, MCI is shown in orange, and AD in indicated by red boxes. In box plots of all figures, the bar inside the box indicates the median; the upper and lower limits of boxes represent the 75th and 25th percentiles, respectively; and bars flanking the box represent the 95th and 5th percentiles. *p < 0.05; **p < 0.01. N, no cognitive impairment.

