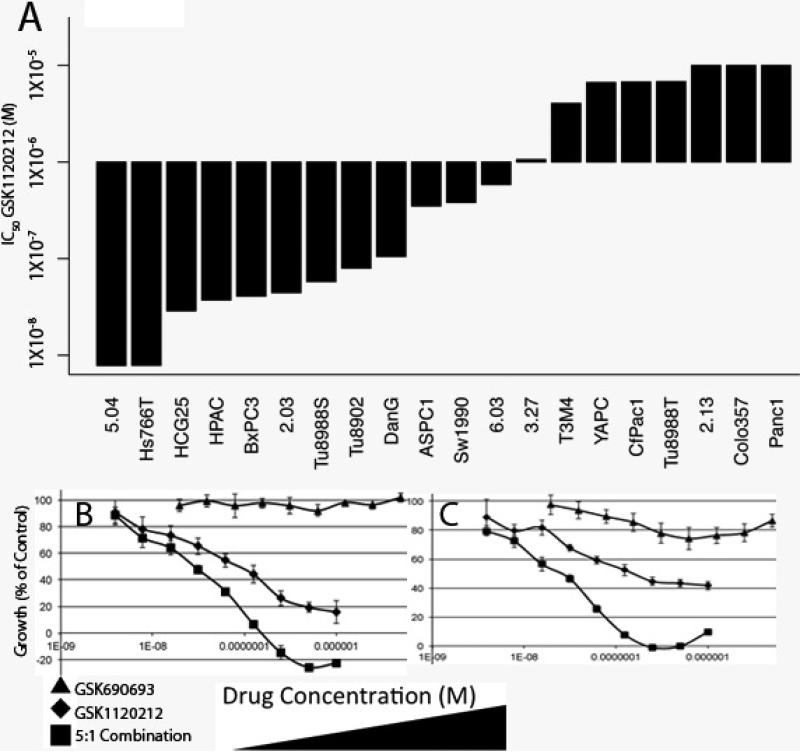
Figure 4.
Combined Inhibition of MEK and AKT leads to synergistic effects across a large panel of PDA cell lines. (A) IC50 measurements of human PDA cell lines treated with MEK inhibitor GSK1120212. Cell lines are on the X axis and IC50 (M) is on the Y axis. Representative dose response curves of (B) 3.27 or (C) Sw1990 treated with either GSK690693 (triangles), GSK1120212 (diamonds), or a 5:1M fixed dose combination ratio of GSK1120212:GSK690693 (squares) plotted as the dose of GSK1120212 in the combination. X axis is drug concentration in M. Y axis is percent growth inhibition at 72 hours. Error bars are +/- standard deviation.

