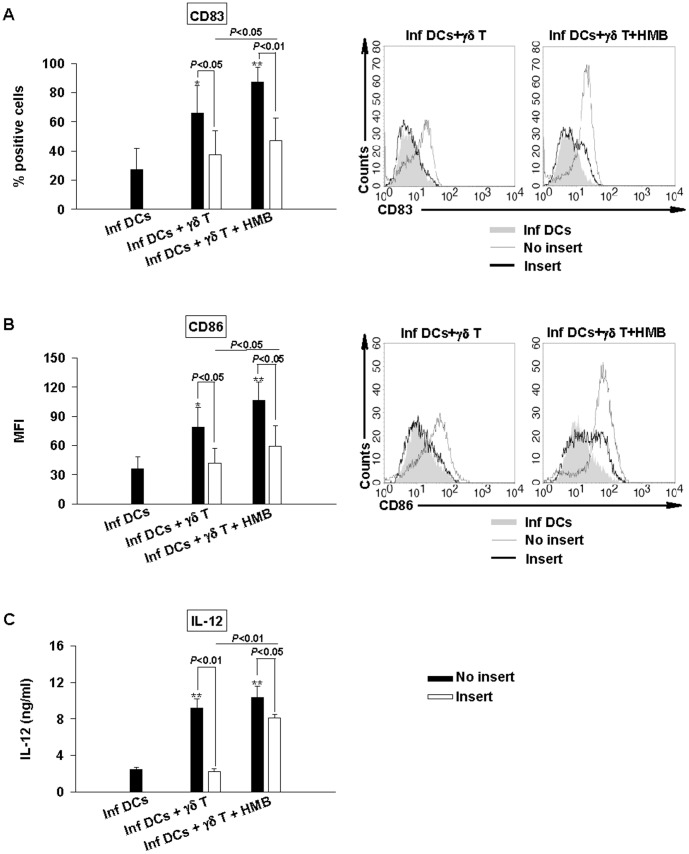
Figure 3. Cell-cell contacts between Vγ9Vδ2 T cells and infected DCs are required for maturation process.
Brucella-infected DCs (MOI = 20) were cocultured in contact (black bars) or separated by a trans-well chambers (insert, white bars) with Vγ9Vδ2 T cells in the presence or not of HMB-PP (0.2 nM). At 48 h p.i., supernatants were collected and cells were stained. CD83 (A, left panel) and CD86 (B, left panel) expression analyses were realized on CD1a+ cells by flow cytometry. Data shown are the mean +/− SD of three independent experiments performed with cells from different donors. Representative flow cytometry histograms show the expression of CD83 (A, right panel) and CD86 (B, right panel) of infected DCs alone (filled grey), cocultured in contact (grey line) or separated (black line) with HMB- or not- stimulated Vγ9Vδ2 T cells. IL-12 was assessed by ELISA test in the collected supernatants (C). Data shown are the mean +/− SD of triplicates and are representative of the three experiments. A significant difference between infected DCs in the presence or not of Vγ9Vδ2 T cells was calculated by using Student’s t test and is indicated by (*) where p<0.05 and (**) where p<0.01. Significant differences between infected DCs in contact or not with Vγ9Vδ2 T cells and between HMB- or not- stimulated Vγ9Vδ2 T cells are indicated directly on the graph.

