
Figure 4. Role of IFN-γ and TNF-α on DC maturation induced by Vγ9Vδ2 T cells.
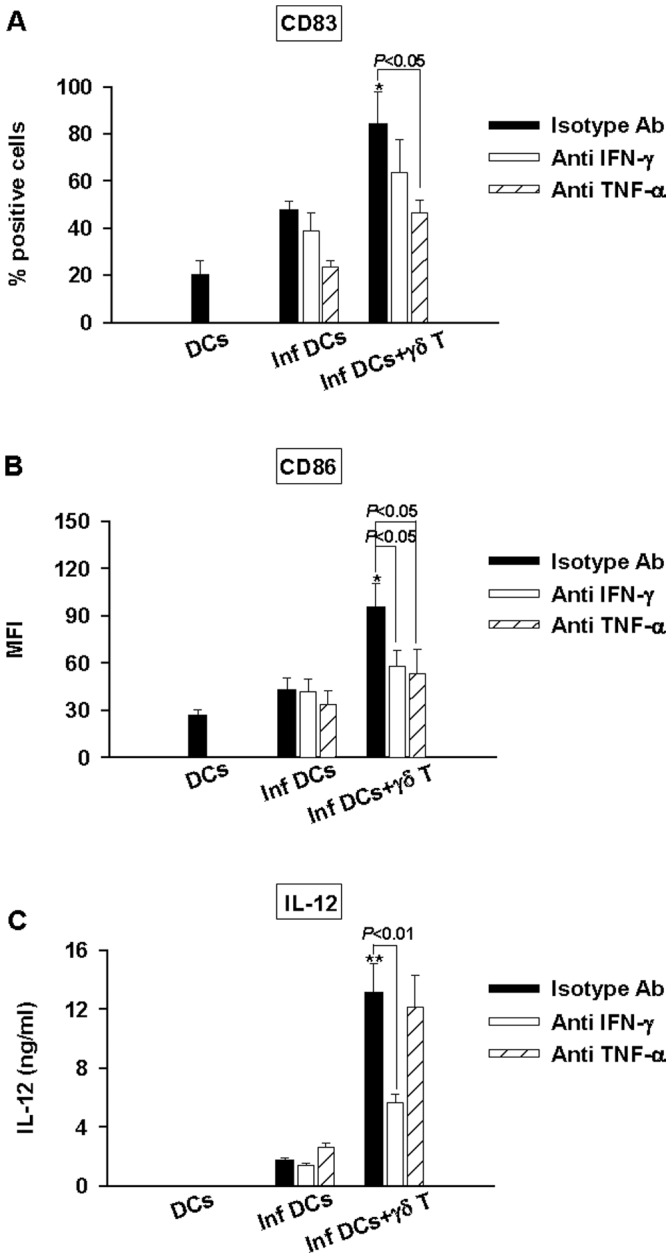
DCs (DC), infected DCs (inf DC) and infected DCs in the presence of Vγ9Vδ2 T cells (infDCs+γδT) were cultured with neutralizing mAbs to IFN-γ (white bars), TNF-α (striped white bars) or with isotype control Ab (black bars). At 48 h p.i., supernatants were collected and cells were stained with FITC-conjugated mAbs to CD83 (A), CD86 (B). CD83 and CD86 expression analysis were realized on CD1a+ cells by flow cytometry. IL-12 was assessed by ELISA in the collected supernatants (C). Data shown are the mean +/− SD of triplicates and are representative of the three experiments. The Student’s t test was used to calculate significant differences between: - 1: infected DCs in the presence or not of Vγ9Vδ2 T cells and was indicated by (*) where p<0. 05 and (**) where p<0.01 and 2: infected DCs cocultured with Vγ9Vδ2 T cells in the presence of neutralizing mAb or isotype control and is directly indicated on the graph.