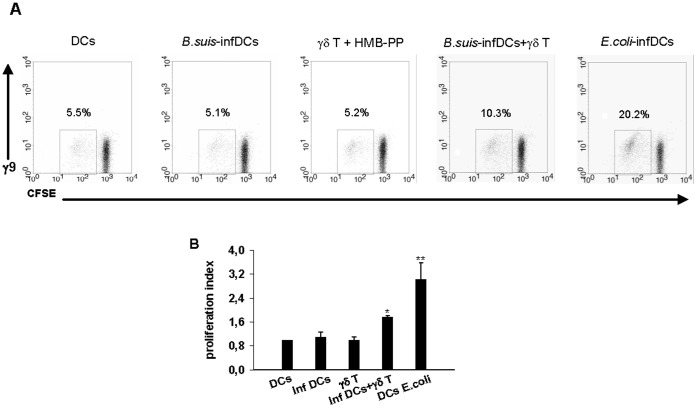
Figure 5. Vγ9Vδ2 T cells increase the capacity of Brucella-infected DCs to induce naive T cell proliferation.
B.suis- or E. coli-infected DCs (MOI = 20) and Vγ9Vδ2 T cells were cultured alone or in coculture for 24 h then CFSE-stained naive CD4+ T cells were added with DC/T cell ratio: 0.1. After 5 days, the proliferation of CD4+ T cells (γ9- CFSE+) was analyzed by flow cytometry and the proliferation index was calculated by comparison with non-infected cells. (A) Representative flow cytometry dot plots showing the proliferation of CD4+ T cell. Values for the percentages of proliferated CFSE+ and γδ− cells are indicated upper of the region. (B) Data represent the mean of duplicates +/− SD of three independent experiments performed with cells from different donors. Statistical differences were calculated by comparison with Brucella-infected DCs by using Wilcoxon Rank test and are indicated by (*) where p<0. 05 and (**) where p<0.01.

