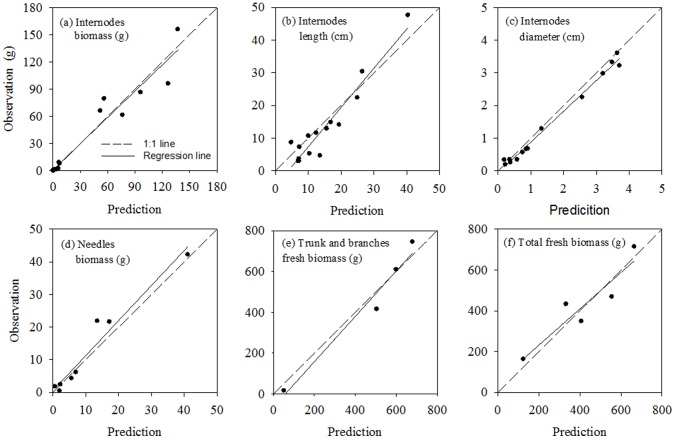
Figure 6. Comparison of fresh biomass, length, diameter between prediction and observation of three six-year-old pines measured in 2006.
The regression equations between observations and predictions and statistical tests for each indicator are listed as following: (a) Internodes biomass, y = 1.01+0.96x, (R 2 = 0.93, p<0.0001, n = 15); (b) Internodes length, y = −4.64+1.20x, (R 2 = 0.91, p<0.0001, n = 15); (c) Internodes diameter, y = −0.06+0.94x, (R 2 = 0.99, p<0.0001, n = 15); (d) Needles biomass, y = 0.57+1.07x, (R 2 = 0.99, p<0.0001, n = 8); (e) Trunk and branches fresh biomass, y = −64.84+1.11x, (R 2 = 0.97, p = 0.0168, n = 4); (f) Total fresh biomass, y = 54.46+0.89x, (R 2 = 0.86, p = 0.0235, n = 6).

