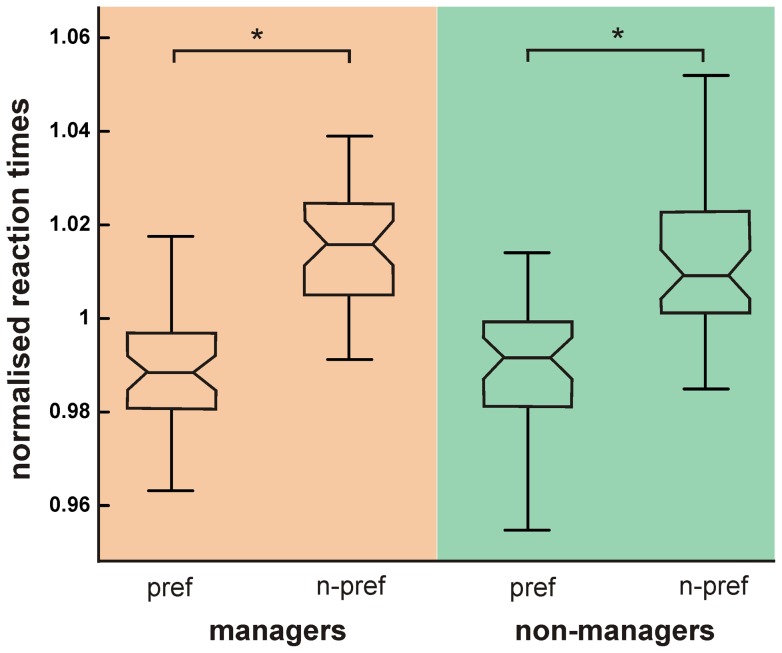
Figure 2. Response time (RT) analysis of managers and non-managers.
Box plots showing mean normalized RTs with percentiles (normalized by each subject’s mean RT to account for considerable intersubject variability) for decisions for preferred and non-preferred value words. Asterisks mark significant RT differences. Note the interaction effect in favour of the managers (see text).

