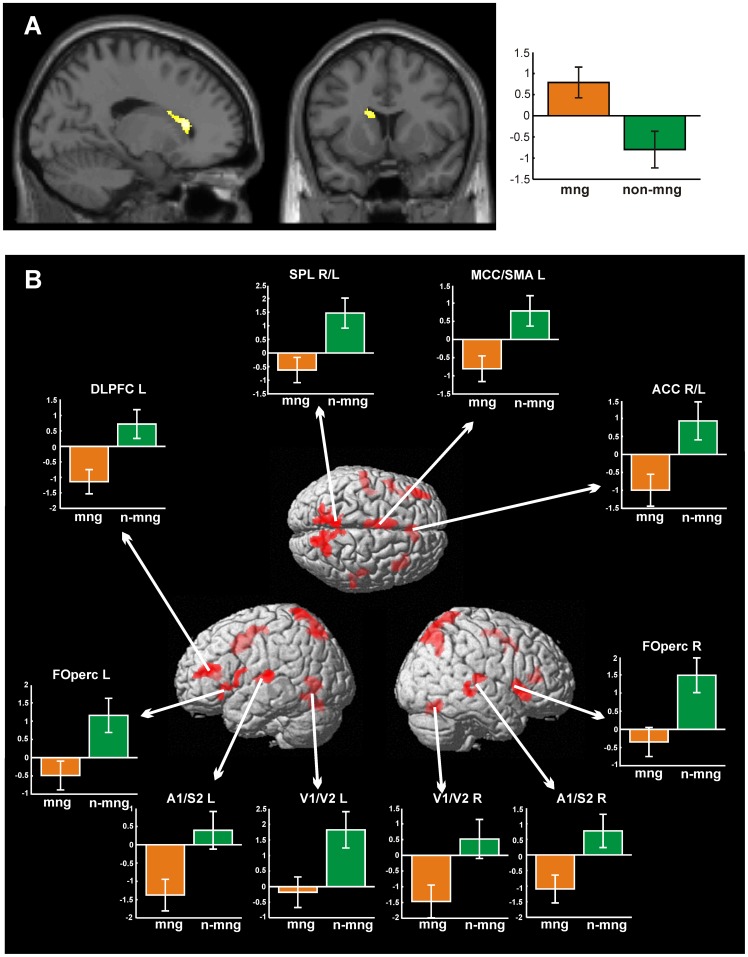
Figure 3. Significant differential effects of fMRI analysis (cluster-level corrected at p<0.0013).
(A) Contrast managers (mng) > non-managers (n-mng). (B) Contrast non-managers > managers, projected onto sections and rendered surface of the MNI single subject template. Bar graphs provide mean-centred parameter estimates (i.e. strength of the BOLD response). Error bars provide 90% confidence intervals. ACC anterior cingulate cortex, DLPFC dorsolateral prefrontal cortex, FOperc frontal operculum, MCC midcingulate cortex, SMA supplementary motor area, SPL superior parietal lobule, A1 primary auditory cortex, S2 secondary somatosensory cortex, V1/V2 primary/secondary visual cortex. R right, L left. Peak coordinates: Table 1.

