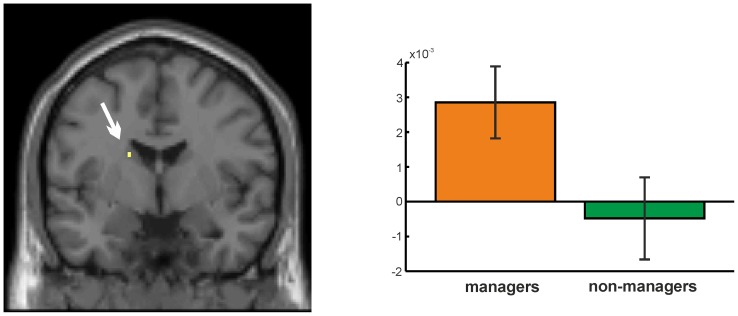
Figure 4. Significant time-related effect over the course of the experiment within the caudate nucleus (arrow, 3 voxels) for the managers as compared to the non-managers (p<0.001).
Bar graphs provide mean-centred parameter estimates (i.e. strength of the BOLD response). Error bars provide 90% confidence intervals.

