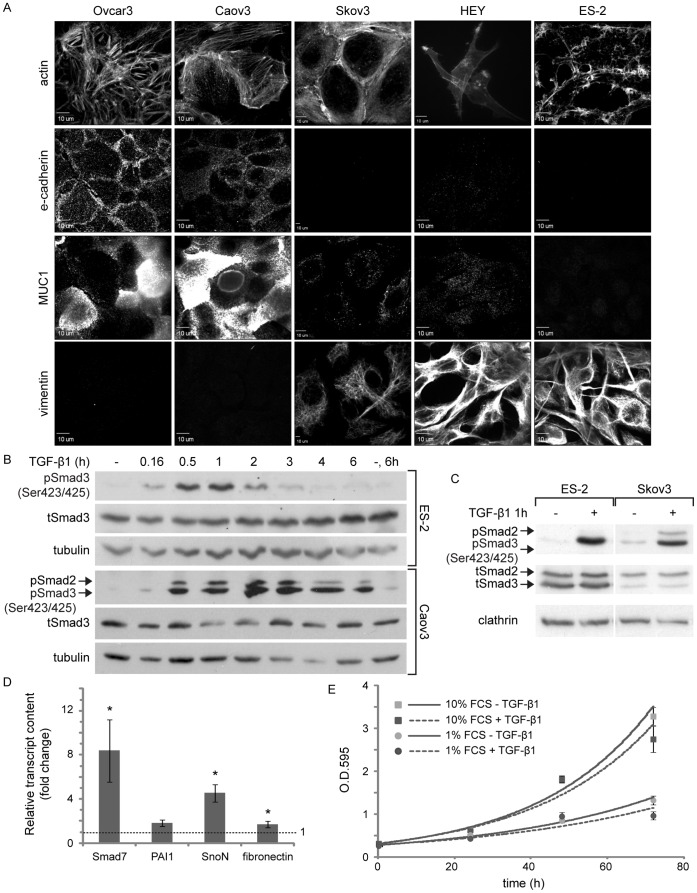
Figure 1. ES-2 ovarian cancer cells have a mesenchymal phenotype and respond to TGF-β1.
A, Panels depict confocal micrographs of different ovarian cancer cell lines (as specified) immuno-stained against e-cadherin, MUC1 and vimentin; or labeled for their actin content using rhodamine-conjugated phalloidin. Note the difference in the pattern of expression of phenotypic markers amongst epithelial-like cells (Ovcar3 and Caov3) and mesenchymal-like cells (ES-2 and HEY). Bar, 10 µm. B, ES-2 and Caov3 cells were stimulated with TGF-β1 (5 ng/ml, here and throughout the manuscript) or vehicle for the indicated times and immunoblotted with α-pSmad3C, α-tSmad3 and α-tubulin (employed here and throughout the manuscript as a protein loading control) antibodies. C, ES-2 and Skov3 cells were stimulated with TGF-β1 or vehicle and immunoblotted with α-pSmad3C, α-tSmad2/3 and α-clathrin (employed here and throughout the manuscript as a protein loading control) antibodies. D, qRT-PCR of Smad7, PAI-1, SnoN and Fibronectin. Bar graph depicts the average ± SEM fold change in normalized transcript content in TGF-β1-treated cultures (2 h) as compared to untreated. Smad7∶ 8.4±2.82, n = 8; p<0.01; PAI1∶ 1.82±0.27, n = 6; p<0.06; SnoN: 4.54±0.77, n = 8; p<0.01; fibronectin: 1.7±0.28, n = 9; p<0.03; all 1-tailed t-tests. E, Growth curve of ES-2 cells treated with TGF-β1 or vehicle. Cells were grown in medium supplemented with 1% or 10% FCS, with or without TGF-β1. Graph depicts the average ± SEM optical density at each time point of a typical experiment (O.D.595, n = 6).

