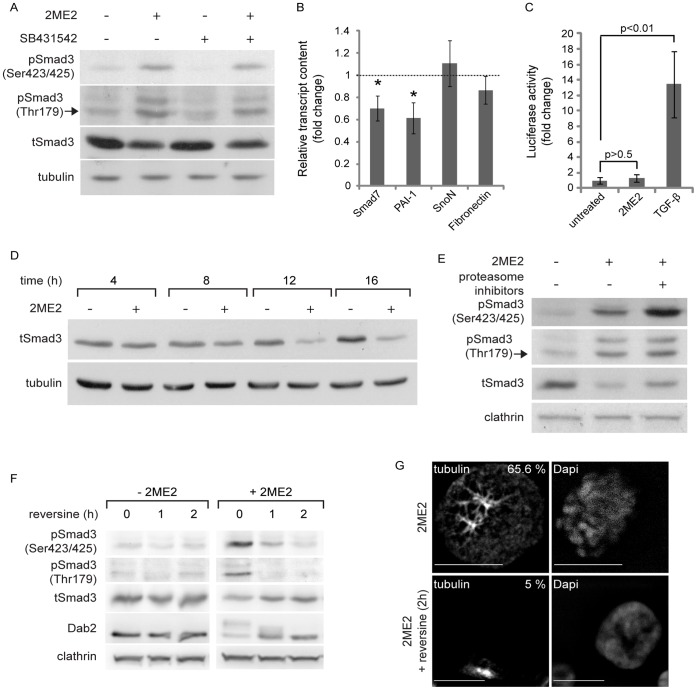
Figure 2. Mitotic arrest with 2ME2 induces Smad3 phosphorylation but not Smad-dependent transcription, and a reduction in Smad3 levels.
A, α-pSmad3C, α-pSmad3(179), α-tSmad3 and α-tubulin immunoblot of ES-2 cells, treated with 2ME2, SB431542, their combination or vehicle. 2ME2-arrested cells show a 4.6±1.5 fold increase in Smad3 phosphorylated at the C-terminus (pSmad3C)/total-Smad3(tSmad3) ratio, n = 14; p<0.016, 1-tailed t-test; and 11.9±2.15 fold increase in Smad3 phosphorylated on Threonine 179 pSmad3(179)/tSmad3 ratio, n = 9; p<0.01, 1-tailed t-test. B, qRT-PCR of Smad7, PAI-1, SnoN and fibronectin. Bar graph depicts the average ± SEM fold change in normalized transcript content in 2ME2-treated cultures as compared to untreated. *, p<0.04, n = 8; all 2-tailed t-tests. C, Transcriptional activation assay. ES-2 cells, co-transfected with the (CAGA)12-Luc reporter construct and pRL-TK (see Material and Methods), were either arrested in mitosis with 2ME2 or stimulated with TGF-β1 (5 ng/ml, 6 h). TGF-β1 induced a 13.4±4.3 fold increase in the normalized luciferase signal, n = 3 independent experiments (6 wells/treatment/experiment); p<0.01, 1-tailed t-test. Arrest in mitosis with 2ME2 did not induce a significant change in luciferase signal; 1.33±0.44 fold, n = 3 independent experiments (6 wells/treatment/experiment); p>0.6, 2-tailed t-test. D, α-tSmad3 and α-tubulin immunoblots of ES-2 cells, treated with 2ME2 or vehicle for the indicated times. At 16 h of 2ME2-arrest the tSmad3/tubulin ratio was reduced to 0.37±0.05 fold of the initial amount, n = 10; p<0.01, 1-tailed t-test. E, α-pSmad3C, α-pSmad3(179), α-tSmad3 and α-clathrin immunoblot of ES-2 cells, arrested in mitosis with 2ME2, and treated or not with proteasome inhibitors (MG132 and ALLN, 3 h). Upon proteasome inhibition, the (pSmad3C/tSmad3)/clathrin ratio increased by 2.3±0.2 fold, n = 5; p<0.02, 1-tailed t-test. F, α-pSmad3C, α-pSmad3(179), α-tSmad3, α-Dab2 and α-clathrin immunoblots of ES-2 cells, treated with 2ME2 or vehicle followed by addition of reversine (5 µM, 0–2 h). G, Confocal micrographs of tubulin and DNA of 2ME2-arrested ES-2 cells, treated or not with reversine (2 h). Bar, 10 µm. Numbers in the upper right-hand corner of the micrographs are the percentage of cells presenting a rounded morphology and a spindle-like organization of the microtubules.

