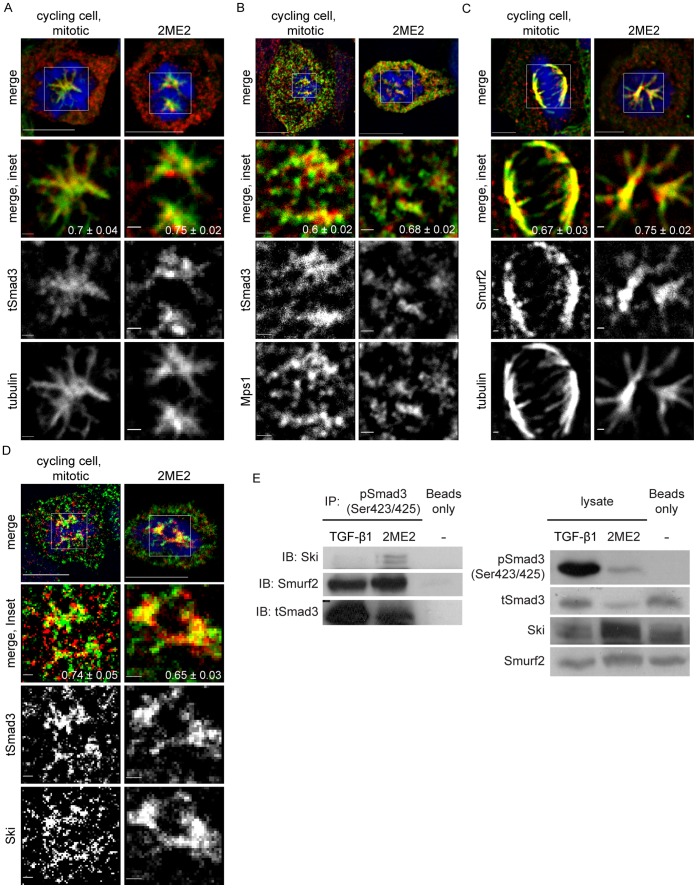
Figure 3. Localization of Smad3, Smurf2, Ski and Mps1 to the mitotic spindle and co-immunoprecipitation of phosphorylated Smad3, Ski and Smurf2 in 2ME2-arrested cells.
A–D, Panels depict a single confocal mid-plane of imaged cells. Bar, 10 µm in upper panel and 1 µm in inset images. The Pearson’s Correlation Coefficient (PCC) of images acquired with 473 nm and 561 nm illumination was calculated with the JaCop plugin of the ImageJ™ software (presented as PCC ± SEM). A, Confocal micrographs of tSmad3, α-tubulin and DNA, of unperturbed-mitotic or 2ME2-arrested ES-2 cells. B, Confocal micrographs of tSmad3, Mps1 and DNA of unperturbed-mitotic or 2ME2-arrested ES-2 cells. C, Confocal micrographs of Smurf2, α-tubulin and DNA of unperturbed-mitotic or 2ME2-arrested ES-2 cells. D, Confocal micrographs of tSmad3, Ski and DNA of unperturbed-mitotic or 2ME2-arrested ES-2 cells. E, Immunoprecipitation with α-pSmad3C or sepharose beads alone (control) of lysates of cells treated with TGF-β1 (1 h) or 2ME2 (16 h). Left panel: Immunoprecipitates were separated by SDS-PAGE and immunoblotted with α-Ski, α-Smurf2 and α-tSmad2/3 antibodies. In 2ME2-arrested cells, Ski and Smurf2 co-immunoprecipitated with pSmad3C at 7.7±1.7 fold and 2±0.25 fold (respectively) higher levels than in TGF-β- stimulated cells, (n = 3; p<0.02, 1-tailed t-test). Right panel: 5% of the lysates, prior to immunoprecipitation, were immunoblotted with α-pSmad3C, α-tSmad3, α-Ski and α-Smurf2 antibodies.

