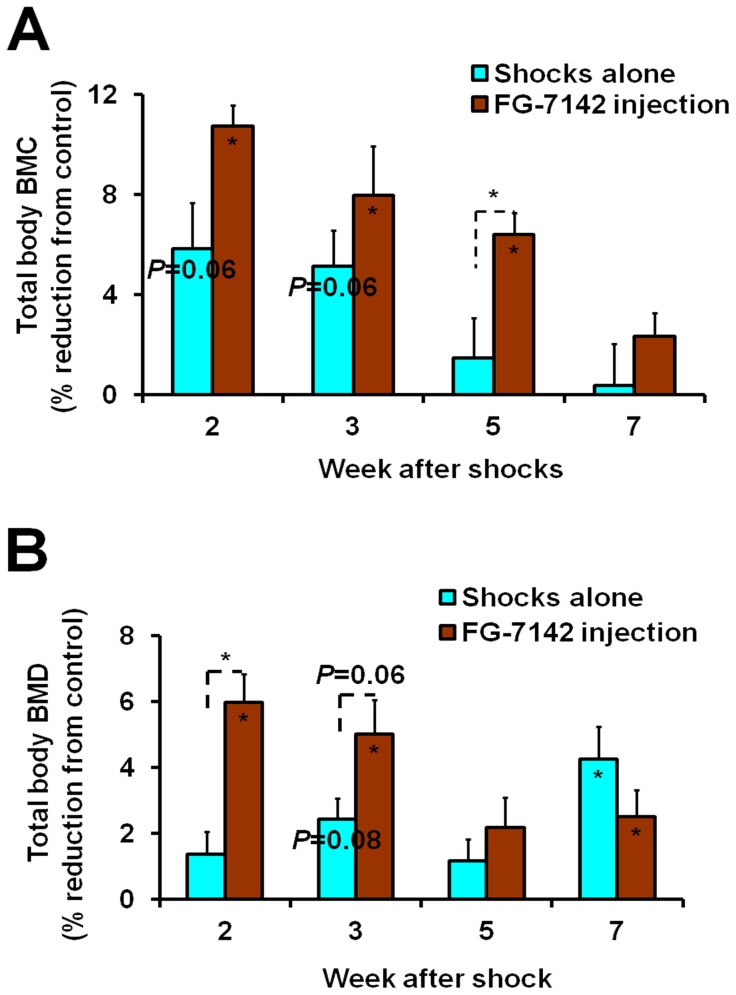
Figure 4. Reductions of bone mass parameters in total body caused by electric shocks alone and electric shocks plus FG-7142 injection.
(A) BMC. The percentage reductions for BMC were calculated from body weight adjusted values. (B) BMD. Values for each parameter are means and S.E.M of percentage reductions compared to the control. The significance of each treatment compared to the control at each time point is indicated by the actual P value or an asterisk for P<0.05 inside the corresponding bar. The significance between two treatments is indicated by the actual P value or an asterisk for P<0.05 above the corresponding bars.

