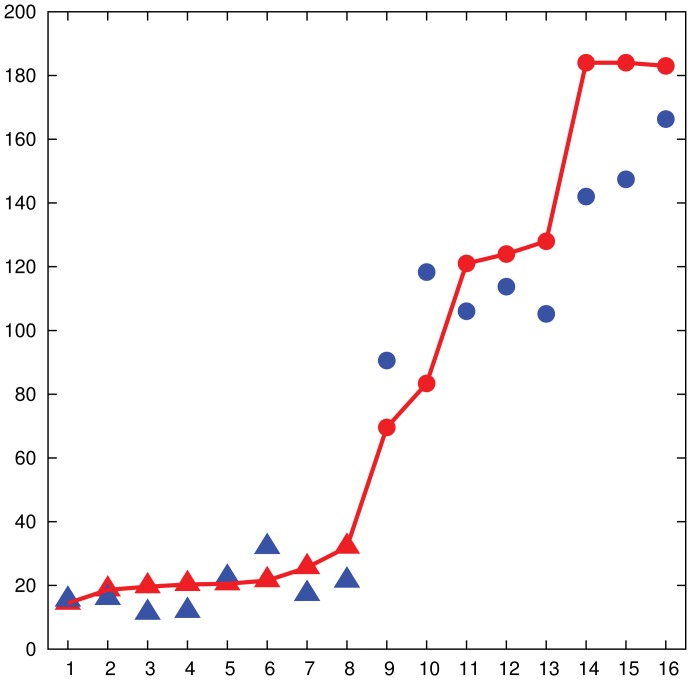
Figure 3. Affinity between humans' and algorithm's performance, 16-node networks.
The performance of the human subjects (red points joined by continuous line) and of the algorithm (blue points) over eight bipartite 16-node networks (triangles) and eight non-bipartite 16-node networks (circles) are plotted. The experiment was run multiple times on each network and the average behavior is reported. The  -axis shows the indexes of the networks sorted by increasing average time required to reach a maximum matching. Bipartite networks are labeled from 1 to 8, while non-bipartite networks are labeled from 9 to 16. The
  -axis shows the average time (in seconds) required to reach a maximum matching for humans, while the average number of rounds of the algorithm is scaled by a constant factor.

