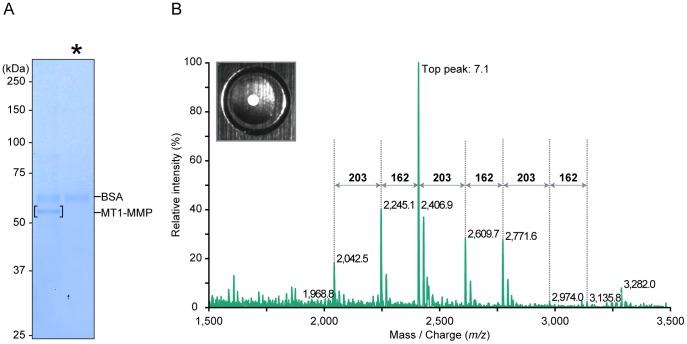
Figure 2. MS spectrum of tryptic MT1-MMP digests within the central area of 3AQ/CHCA.
(A) Endogenous MT1-MMP was immunoprecipitated with anti-MT1-MMP antibody-conjugated resin from membrane lysates of wild-type HT1080 cells and was further separated by SDS-PAGE and staining with Coomassie Blue. Sialidase, which contains BSA as a carrier protein, was loaded in the light lane (denoted by asterisk). Numbers on the left of the panel represents molecular masses in kilodaltons (kDa). (B) The polypeptide band corresponding to MT1-MMP was excised, digested in-gel with trypsin. An aliquot of tryptic MT1-MMP digest derived from HT1080 cells was applied directly onto the liquid matrix 3AQ/CHCA on the MALDI target plate. MS spectrum was obtained within the central area of the liquid matrix (open circle [○]). A stereoscopic microscope image of the sample spot is shown in the left upper insert. Number represents the cumulative intensity of the top peak (arbitrary units).

