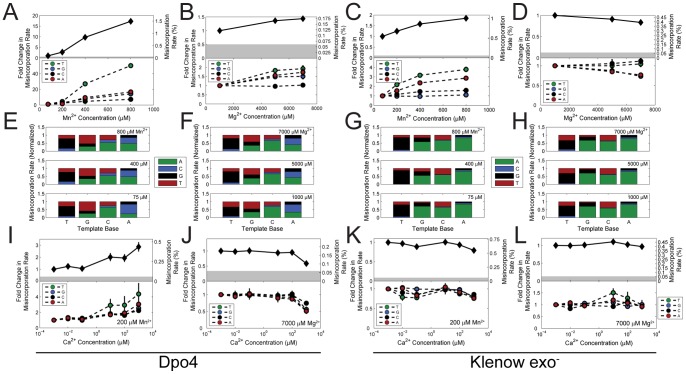
Figure 2. Ion-dependent misincorporation rates of Dpo4 and Klenow exo− polymerases.
(A, B, C, D) Mean (top) and template-base-specific (bottom) misincorporation rates as a function of Mn2+ (A, C) and Mg2+ (B, D) concentrations. (E, F, G, H) Normalized distributions of misincorporated dNTPs for each template base. (I, J, K, L) Mean (top) and template-base-specific (bottom) misincorporation rates as a function of Ca2+ concentration at 200 µM background Mn2+ (I, K) and 7000 µM background Mg2+ (J, L) concentrations. Errors are given in Tables S1–2, and are shown as error bars in the line graphs when they are larger than the data symbol.

