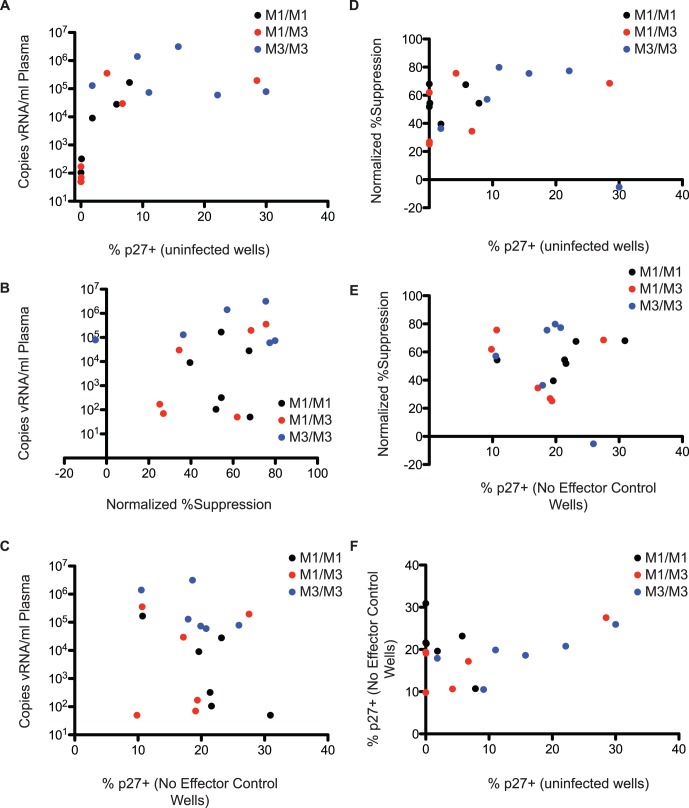
Figure 2. Viral load does not correlate with CD8 T cell efficacy in vitro.
A) Plasma viral loads were plotted against the percentage of p27+ cells after eight days in culture in wells where cells were not superinfected in vitro. These results display the growth of autologous virus. B) Viral loads were plotted against the normalized percent suppression on autologous target cells. C) Viral loads were plotted against the percentage of target cells that were p27+ after in vitro superinfection in the no effector control wells. D) The normalized % suppresion was plotted against the percentage of p27+ targets in the no infection control wells. E) Normalized percent suppression was plotted against the percent of p27+ targets in the no effector control wells. F) The percent of p27+ targets in the no infection wells was plotted against the percent of p27+ targets in the no effector control wells.

