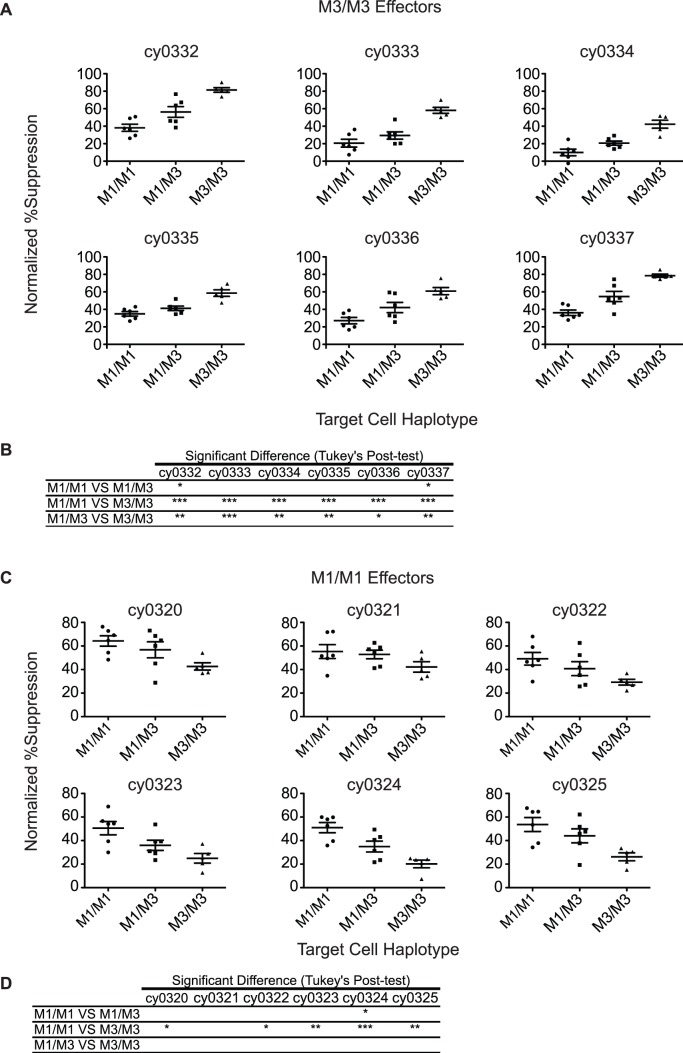
Figure 3. Viral suppression by effector cells from homozygous animals.
A) Each plot represents the results from an individual M3/M3 effector animal on each target animal. Each column in the graph displays a different target animal haplotype. B) Table showing the Tukey’s Multiple Comparison Test of the columns in each of the graphs (*p<0.05; **p<0.01; ***p<0.001). C) Each plot represents the results from an individual M1/M1 effector animal on each target animal. Each column in the graph displays a different target animal haplotype. D) Table showing the Tukey’s Multiple Comparison Test of the columns in each of the graphs (*p<0.05; **p<0.01; ***p<0.001).

