
Figure 4. Effect of MPT0E028 and SAHA on α-tubulin and histone H3 acetylation.
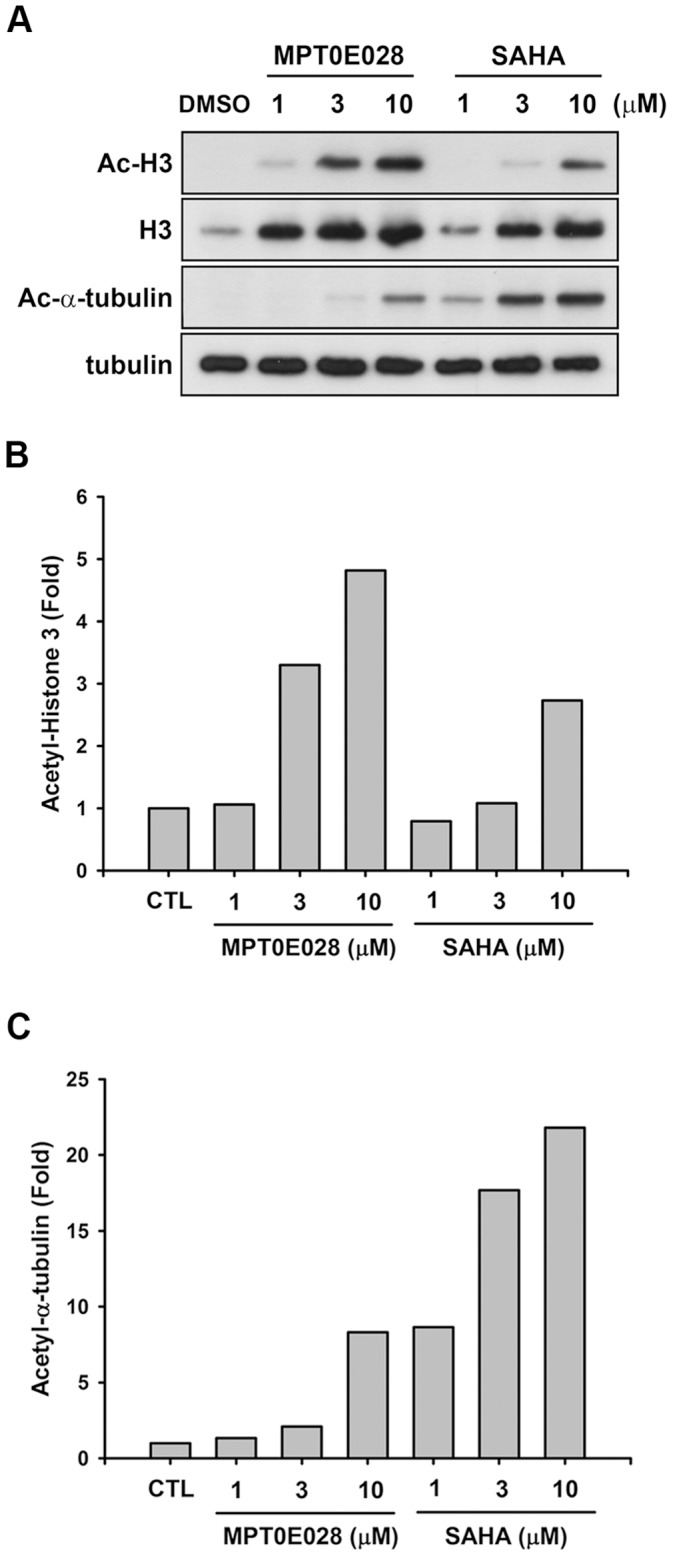
(A) HCT116 cells were treated with MPT0E028 and SAHA for 24 h at the indicated concentrations. Cell lysates were prepared and subjected to SDS-PAGE and immunoblotting using acetyl-histone H3, histone H3, acetyl-α-tubulin, and α-tubulin antibodies. Quantitative analysis of western blot with ImageQuant (Molecular Dynamics, USA); acetyl-histone H3 (B) and acetyl α-tubulin (C) were analyzed in HCT116 cells.