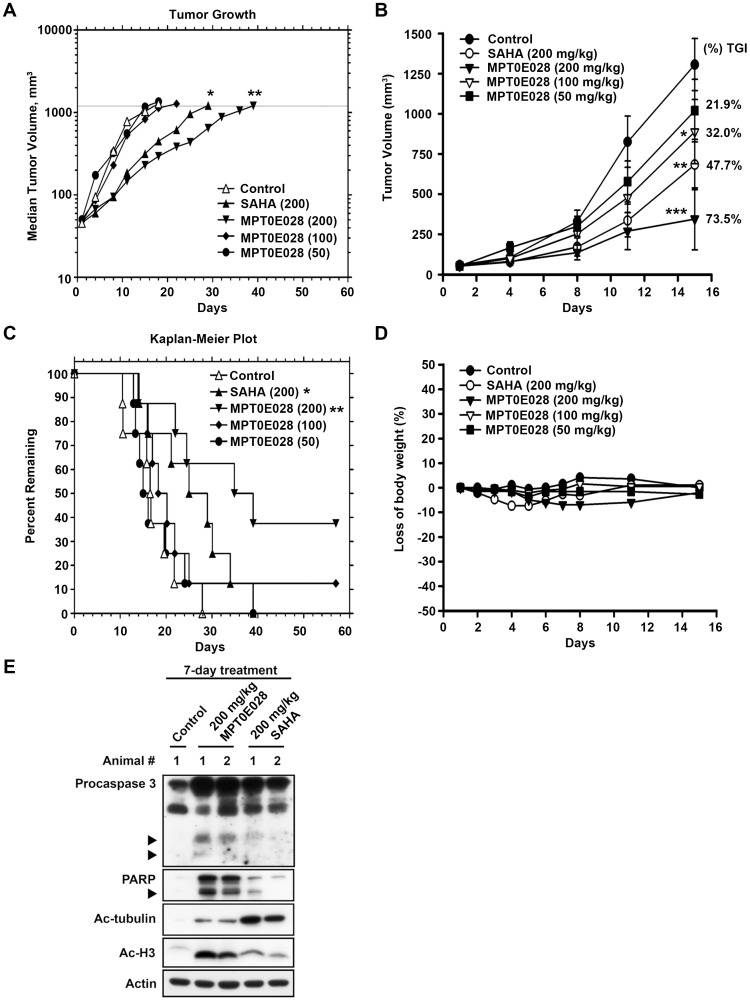
Figure 5. The effect of MPT0E028 on the growth of HCT116 cells in vivo.
All tumors grew to the 1,200-mm3 endpoint volume. (A) Tumors were measured regularly and growth delay was calculated for treatment groups relative to control tumors (TGD). (B) Kaplan-Meier survival analysis was based on the tumor growth endpoint. (C) Inhibition of tumor growth curves represented a mean±SEM and percentage change in mean tumor volume (percent TGI). (D) Body weights were measured daily during the first week and then 2 times per week. The body weight ratio was calculated relative to the baseline measurement. (E) In vivo effect of MPT0E028 on the expression of caspase 3, PARP, acetyl-histone H3 and acetyl-µ-tubulin in HCT116 xenograft tumors as determined by western blotting.

