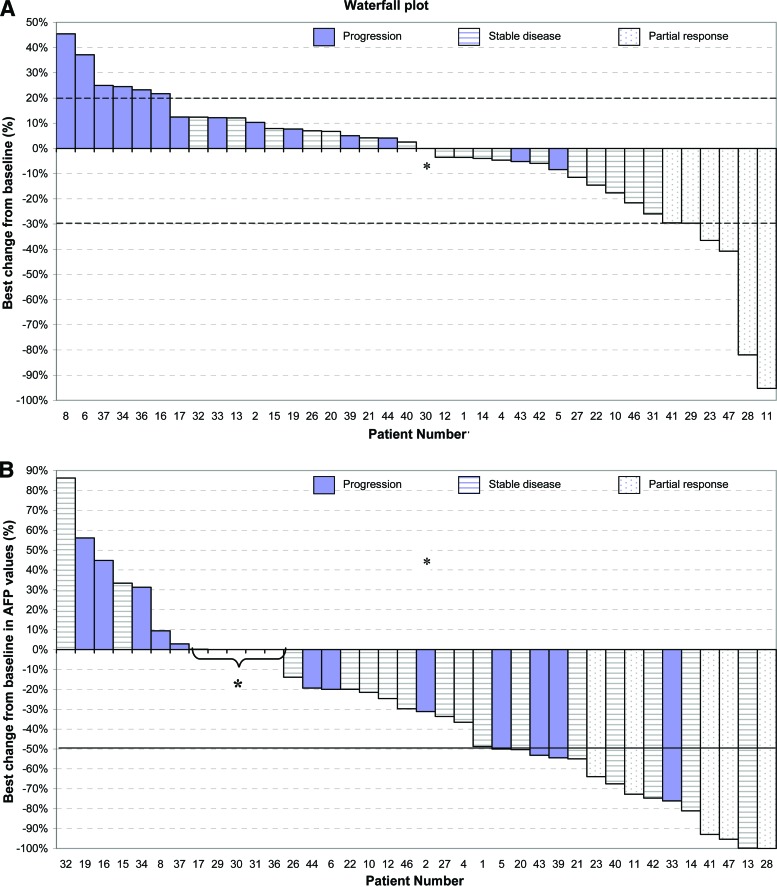
Figure 1.
Changes in tumor area and serum alphafoetoprotein level over time in patients with advanced hepatocellular carcinoma treated with bevacizumab. Waterfall plot of maximum percentage changes in tumor size of index lesions (A) and maximum changes in α-fetoprotein (AFP) levels from baseline (B). Evaluable patients (n = 38) are categorized according to Response Evaluation Criteria in Solid Tumors (version 1.0) as having an objective response (white bars), stable disease (dashed bars), or disease progression (purple bars). Eight patients with a <20% increase in the sum of the largest dimensions of the target lesions were categorized as having disease progression because of the appearance of new lesions.
*0% decrease or increase.

