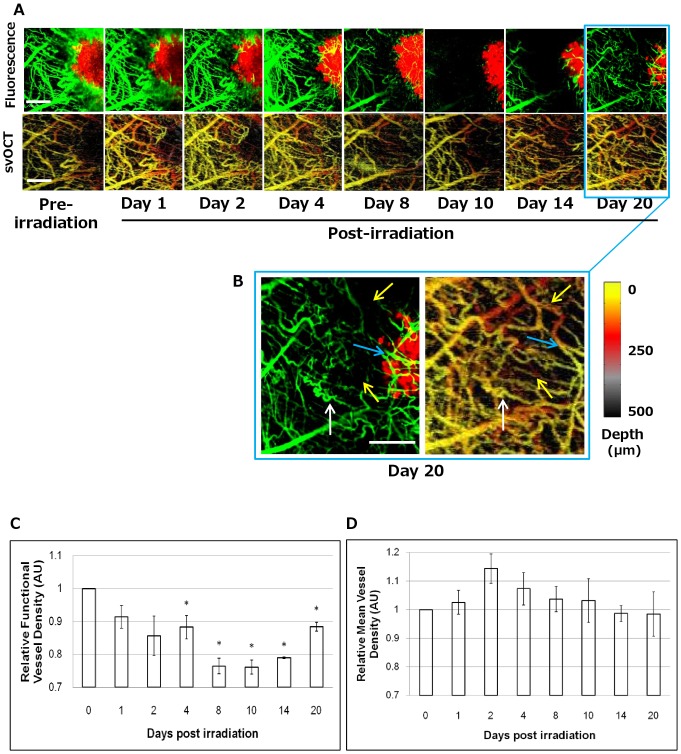
Figure 3. Longitudinal intravital fluorescence and svOCT imaging of radioresponse in tumor and vascular compartments in vivo.
A. Functional changes in perfusion in the tumor microvasculature can be seen over time (FITC-Dextran fluorescence, green) as well as tumor response (DsRed fluorescence, red) following a single fraction of 30 Gy. Image acquisition settings were kept consistent across all the time points. As early as day 4, and maximally at days 8–10 after irradiation, FITC-Dextran signal decreases significantly, indicating capillary constriction resulting in reduction in perfused blood volume. By day 10, there is disruption of blood flow in both large (∼40 µm diameters) and small (∼10 µm diameters) vessels outside and within the tumor. However, the vasculature at these time points is still intact (as seen in svOCT images of corresponding time points). B. At day 20 after irradiation, blood vessel perfusion resumes in most vessels around the tumor periphery (white arrows), while some vessels appear patent (seen intact in svOCT) without reperfusion as seen in FITC-Dextran (yellow arrows), and newly perfused vessels can be observed within the tumor (blue arrows). Corresponding svOCT images demonstrate structural changes in the vasculature, particularly close to the tumor margin and within the tumor after irradiation. This was most pronounced at days 8–10. Quantification of C. functional vessel density (FITC-Dextran) and D. mean vessel density (svOCT), normalized to day 0, of 3 ROI's in irradiated mouse over 20 days. Scale bars: 400 µm (A,B).

