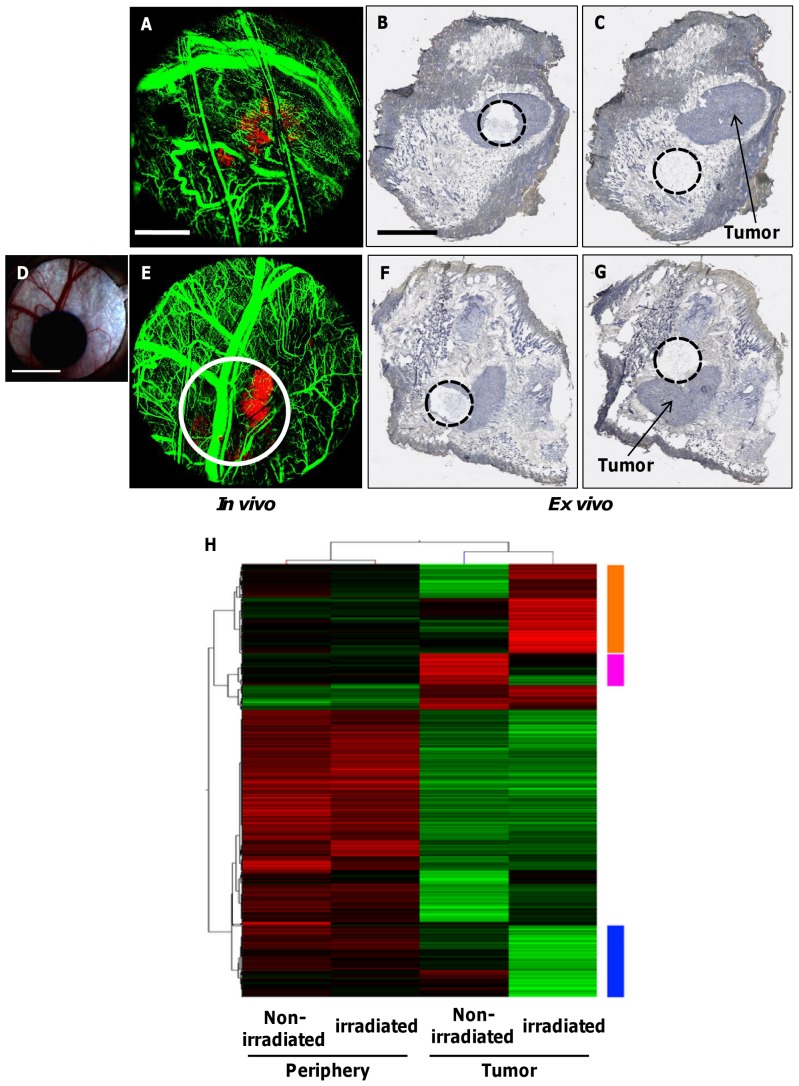
Figure 7. Spatially-localized analysis of genomic expression in non-irradiated and irradiated tumors.
A. In vivo fluorescence imaging of DSWC area showing DsRed-Me180 tumor (red) and FITC-Dextran labeled vasculature (green) in a non-irradiated mouse. B, C. Corresponding ex vivo tissue cross sections (counterstained with hematoxylin for histological context) of non-irradiated mouse showing precise location of LCM capture sites within and outside (periphery) the tumor, respectively. D. Photograph of radiochromic film showing the irradiation field (single 30 Gy dose) within the window chamber area of another mouse. E. In vivo fluorescence imaging shows location of radiation field (white circle) with respect to tumor and vasculature in the irradiated mouse. F, G. Corresponding ex vivo tissue cross sections of irradiated mouse showing locations of LCM capture sites within and outside the irradiated tumor, respectively. The mouse was sacrificed 4 days following irradiation for gene expression analysis. H. Two-way hierarchical clustering of probes showing the highest variability in 4 samples of irradiated and non-irradiated tumor and peripheral tissue areas. Orange: probes showing specific up-regulation in the irradiated tumor. Blue: probes showing specific down-regulation in the irradiated tumor. Pink: probes showing specific up-regulation in the non-irradiated tumor. (n = 2 mice) Scale bars: 2 mm (A), 3 mm (B), and 4 mm (D).

